Cleaning Air Purifier Sensors and Intakes Without Damage

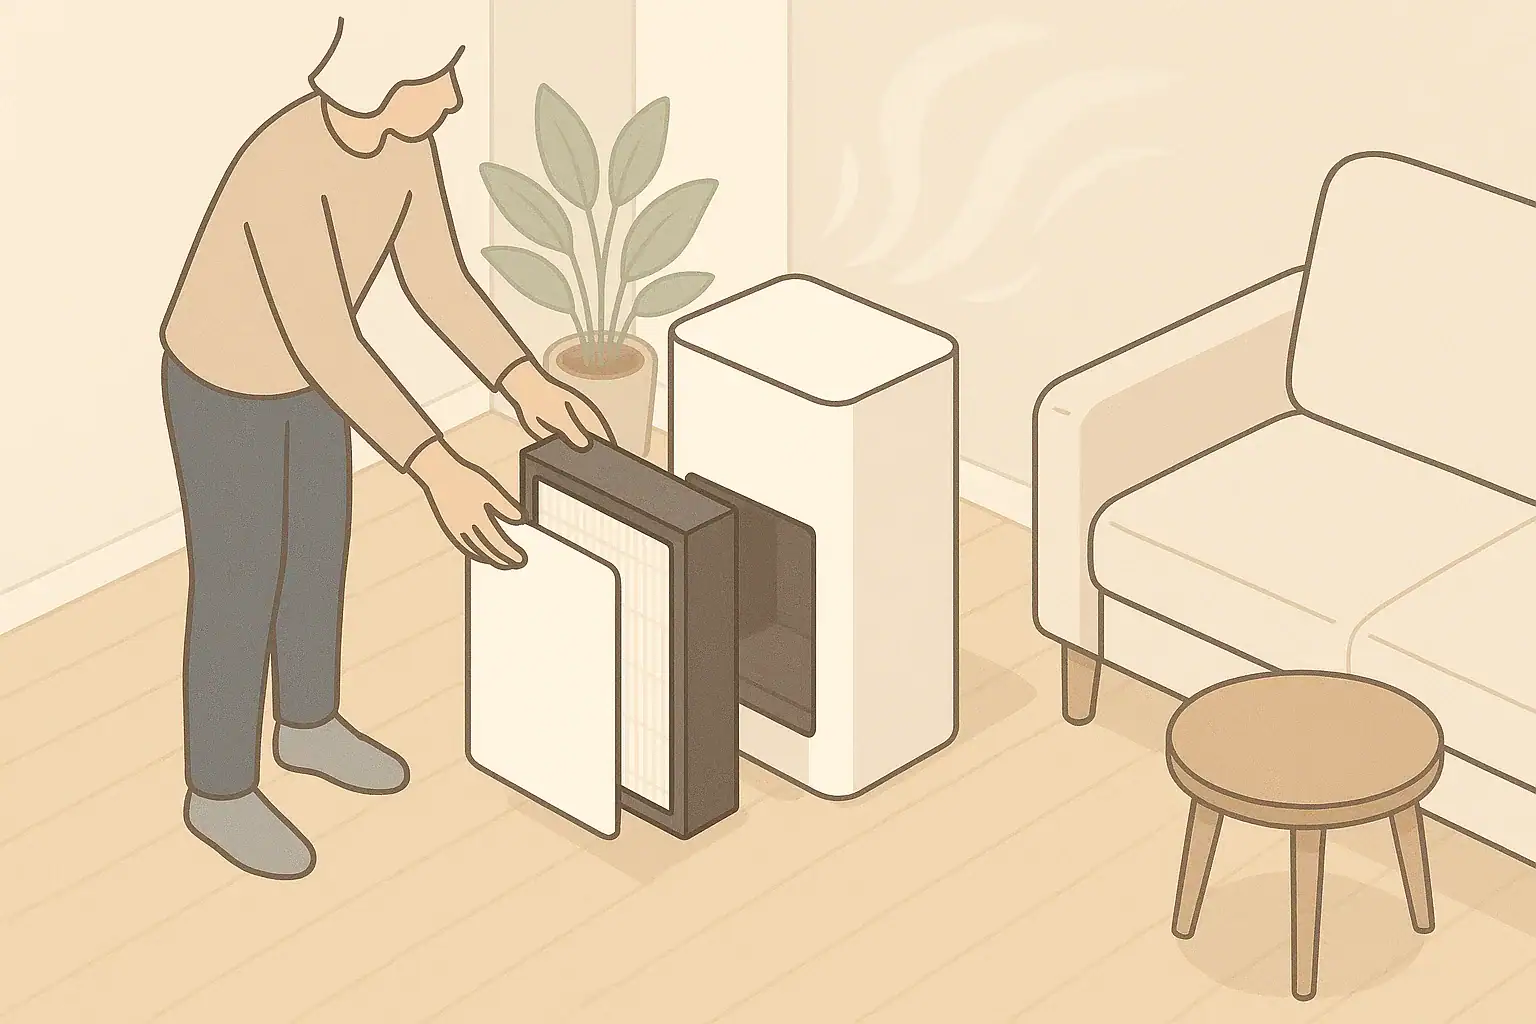
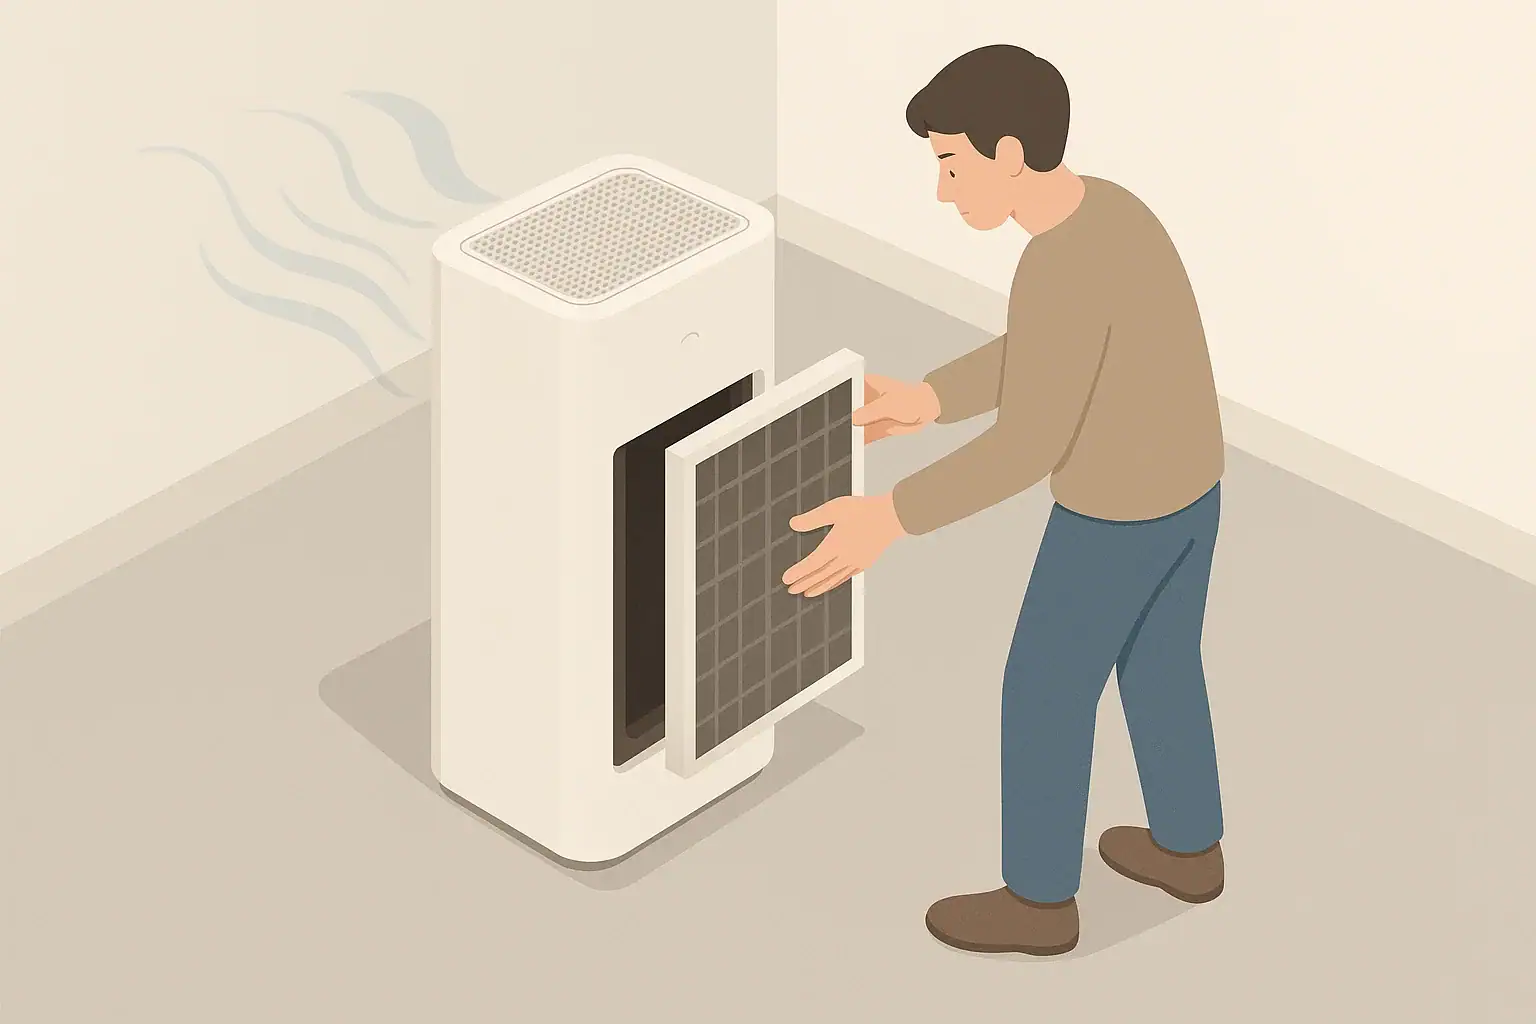
Person gently removing filter from home air purifier for cleaning

When cleaning air purifier sensors and intakes, avoid liquids, harsh tools, strong air pressure, and any steps that bypass covers or safety parts.

Air purifiers work best when their sensors and air intakes stay clear of dust, but they are also some of the most delicate parts of the unit. A few common cleaning habits—like spraying cleaners directly into vents or using powerful compressed air—can quietly damage sensors, bend intake grilles, or reduce filter sealing, even if the purifier still turns on.

Quick answer
  • Avoid spraying water, cleaners, or disinfectants directly into sensors or intake grilles.
  • Do not use high-pressure compressed air; aim for gentle airflow or a soft brush instead.
  • Skip alcohol wipes and solvents on optical sensors unless the manual explicitly allows them.
  • Never run the purifier with filters removed or mis-seated just to “blow dust out.”
  • Keep metal tools, sharp objects, and vacuum nozzles away from exposed sensors and delicate fins.
  • Clean lightly every 1–3 months, checking the user manual for model-specific instructions.

Why Sensor and Intake Cleaning Matters for Indoor Air Quality

Air purifier sensors and intakes do different jobs, but both shape how well your purifier handles indoor air. The intake is where room air enters the unit and passes through filters. The sensors, when present, help the purifier adjust fan speed and provide basic feedback about airborne particles or other conditions.

As dust, lint, and pet hair accumulate on intake grilles, the purifier has to work harder to move the same amount of air. This can lower the effective air changes per hour (ACH) in the room. Dust on or inside sensors can cause inaccurate readings, making automatic modes run too slowly or too aggressively, which wastes energy and may reduce comfort.

Careful cleaning helps maintain:

  • Airflow through the intake so the purifier can reach its intended clean air delivery rate (CADR).
  • Stable sensor readings, especially for PM2.5 sensors used by some models.
  • Filter life, by limiting dust bypass and buildup around seals and gaskets.

Key Parts: What You Are (and Are Not) Cleaning

It helps to distinguish which parts you should touch and which should stay mostly hands-off. Many problems start when someone treats a delicate sensor like a rugged filter or vent.

Air intake areas

The intake usually appears as a grille or series of slots where air is pulled into the purifier. On many units it may be on the front, back, or sides, and sometimes around the entire lower perimeter. Dust tends to collect on these openings as air constantly flows through.

On the inside, just behind the intake, you usually find the pre-filter and the main filters (for example, a HEPA-type filter and possibly an activated carbon layer). Those are intended to capture dust and other contaminants, and they are typically removable for replacement or gentle cleaning as directed by the manual.

Sensors and sensor inlets

Some purifiers include built-in sensors. The most common types related to cleaning are:

  • Particle (PM2.5) sensors – usually optical sensors that pull a tiny stream of air past a light source.
  • Dust sensors – similar concept, sometimes with a small window or opening.
  • Basic air quality indicators – often share a particle sensor or use a simple dust detector.

These sensors may sit behind a small grille or recessed opening. The sensitive area is typically an internal chamber that should not be touched directly. Cleaning normally focuses on dust around the sensor inlet rather than inside the sensor body itself, unless the manual gives specific steps.

What is usually off-limits

In general, avoid touching or aggressively cleaning:

  • Internal sensor windows or lenses.
  • Fan blades and motor components unless the manufacturer provides clear instructions.
  • Circuit boards and internal wiring.

These parts can be sensitive to moisture, static, and physical stress, so cleaning focuses on external dust and easily accessible surfaces.

Table 1. Common cleaning tasks and why rough methods cause problems – Example values for illustration.
Checklist of air purifier cleaning tasks and what not to do
Task Why it matters What not to do
Dusting intake grilles Keeps airflow closer to the purifier’s design level. Do not scrub with abrasive pads or metal brushes.
Cleaning sensor inlets Helps sensors avoid falsely high or low readings. Do not blow high-pressure air directly into sensor openings.
Vacuuming pre-filters Reduces visible dust load between filter changes. Do not press hard with the nozzle or bend the frame.
Wiping outer housing Prevents dust and residue from migrating into vents. Do not let liquid run into seams or control panels.
Resetting filter indicators Keeps maintenance reminders aligned with actual use. Do not reset without checking filters physically.
Checking filter seals Helps limit bypass where air skips the filter. Do not trim gaskets or add homemade spacers.

Example values for illustration.

Common Cleaning Mistakes That Can Damage Sensors and Intakes

Many air purifiers stop working well long before they fail completely, often because of small cleaning habits that seemed helpful at the time. Knowing what not to do can keep both sensors and intakes closer to their original condition.

Using liquids directly on vents or sensors

Spraying glass cleaner, disinfectant, or even plain water straight into intake grilles or sensor openings is a frequent source of trouble. Liquids can migrate deeper into the unit than expected, wetting filters, rusting metal parts, or leaving residue on sensor optics.

Instead of spraying, lightly dampen a cloth away from the purifier and wipe accessible external surfaces. For sensor inlets, most manuals recommend only dry cleaning (such as a soft brush or cotton swab around, not inside, the opening), if any cleaning at all.

Overusing compressed air or strong vacuum suction

High-pressure compressed air can force dust deeper into sensor chambers or push debris into fan bearings. It may also spin fans faster than intended, stressing bearings or electronics. Similarly, a vacuum nozzle placed directly against an intake grille or sensor inlet can bend fins and dislodge parts.

If you use canned air at all, keep it at a safe distance with short, gentle bursts and avoid blowing directly into sensor openings. For vacuuming, stay a few inches away and use a brush attachment with light contact only on sturdy grilles.

Touching sensor windows and internal parts

Optical sensor windows and internal surfaces are designed to be aligned and clean from the factory. Fingerprints, scratches, and fibers can interfere with how they scatter or detect light, leading to readings that drift over time.

Unless the manual provides specific access steps, avoid opening sensor housings or touching internal parts. If the sensor seems far off, a general exterior cleaning and filter check are safer first steps than disassembly.

Running the purifier without filters “to blow it out”

Sometimes people remove filters and run the unit on high to try to clear dust. This can send unfiltered dust through the fan and toward sensors, where it can be harder to remove later. It may also change the airflow pattern enough that particles settle in places they normally would not reach.

In general, operate the purifier only with filters properly installed and seated, and wipe or vacuum external dust instead of relying on fan-only cleaning.

Using harsh chemicals, solvents, or alcohol on plastics

Strong cleaners, including some alcohol solutions, can cloud plastics, weaken sensor housings, or swell rubber gaskets around intakes and filter frames. Even if damage is not obvious at first, repeated exposure can cause parts to loosen or crack.

For routine cleaning, a slightly damp cloth with mild soap (kept away from openings) or a dry microfiber cloth is usually enough. Always verify any chemical use against the product manual.

Safe, Practical Ways to Clean Air Purifier Intakes

Safe intake cleaning keeps dust from building up where air enters the purifier without pushing debris deeper inside or deforming parts. The goal is gentle, regular maintenance instead of rare, aggressive cleanings.

Step-by-step intake cleaning approach

A typical, low-risk routine for most purifiers looks like this (always cross-check with your user manual):

  • Power off and unplug the purifier before any cleaning.
  • Remove outer covers or grills only if the design allows it without tools or with basic latches.
  • Use a soft brush or microfiber cloth to loosen dust on intake slats, working from top to bottom.
  • Vacuum gently with a brush attachment, staying a short distance from the surface rather than pressing hard.
  • Wipe the exterior surfaces around the intake with a lightly dampened cloth, ensuring no drips enter vents.
  • Let all surfaces dry completely before powering the unit back on if any moisture was used nearby.

Frequency for intake cleaning

How often you clean depends on dust levels and usage, but many households find that a light intake cleaning every 4–12 weeks works reasonably well. Homes with pets, heavy dust, or frequent door opening may need monthly attention, while lower-dust spaces may stretch intervals longer.

What to avoid around the intake

Even when not actively cleaning, a few placement habits help keep intakes clear without extra work:

  • Avoid placing the purifier directly on thick carpets or rugs that can block low intakes.
  • Do not stack items or laundry against intake sides.
  • Keep at least several inches of clearance around intake areas so dust is not funneled from tight corners.

Safe, Practical Ways to Clean Air Purifier Sensors

Sensor cleaning requires a lighter touch and a narrower focus than intake cleaning. In many cases, the safest course is minimal, dry cleaning around sensor inlets only, and only as needed.

Finding the sensor and its inlet

Your manual or product label often shows the general sensor area. It may be marked by a small slot, hole, or recessed grille, sometimes labeled as a dust or PM sensor in the documentation. On some units, the sensor is on the side or back; on others, it may be partly concealed behind a removable cover.

Gentle sensor cleaning method

If the manual allows user cleaning of the sensor area, a conservative method usually includes:

  • Unplugging the purifier and waiting a minute for any internal airflow to stop.
  • Using a soft, dry brush (for example, a small clean artist’s brush) to loosen dust around the sensor inlet.
  • Tapping or gently blowing across the opening from a short distance, not directly into it.
  • Avoiding direct contact with any visible sensor window, lens, or electronic components.

Unless the manufacturer clearly instructs you, avoid inserting cotton swabs or other objects into sensor inlets. It is easy to leave fibers behind or disturb alignment.

When to suspect a dirty sensor

Signs that a sensor may need attention include:

  • The purifier stays on high or low speed in auto mode despite obvious changes in room activity.
  • Indicator lights or basic air quality readings do not change over time, even in dusty situations such as cooking or vacuuming nearby.
  • Readings look very different from a separate, basic particle monitor under similar conditions (keeping in mind that devices will rarely match exactly).

Before focusing on the sensor, ensure filters are not clogged and intakes are not blocked; poor airflow can also lead to unexpected sensor behavior.

Real-World Examples: What Not to Do in Common Scenarios

Looking at a few household scenarios can clarify how seemingly minor choices affect sensors and intakes.

Scenario 1: Pet hair and heavy dust near the floor

A purifier with a low intake is placed near a favorite pet bed. Over time, hair and dust accumulate on the intake grille. Using a stiff brush and strong vacuum suction pressed tightly against the grille may pull hair off, but it can also bend plastic slats or draw hair deeper into the unit.

Instead, gently brush the intake surface, then vacuum at a slight distance. Consider moving the purifier slightly away from the heaviest hair zones to reduce buildup between cleanings.

Scenario 2: Kitchen adjacency and greasy residues

A purifier placed near an open kitchen area can collect fine grease particles along with dust. Spraying degreaser directly on the intake or sensor area can draw liquid into the unit.

Safer alternatives include wiping the exterior housing with a lightly damp cloth, keeping the intake facing away from stovetops, and relying on ventilation or range hoods to manage cooking output before it reaches the purifier.

Scenario 3: Trying to “fix” erratic auto mode

After several months, auto mode seems inconsistent. Assuming the sensor is dirty, someone opens the unit, removes a small internal cover, and cleans the sensor window with alcohol and tissue. The readings change temporarily, but over time the sensor drifts further.

In many cases, leaving the sensor housing closed, cleaning only around the inlet, and replacing or checking filters first is the more reliable path. If a sensor appears truly faulty, contacting the manufacturer or a service professional is usually safer than disassembly.

Safety, Standards, and Built-In Features to Respect

Air purifiers include design features and safety measures that can be unintentionally defeated by overzealous cleaning. Respecting these safeguards helps avoid new issues while trying to solve old ones.

Do not bypass covers or interlocks

Many units have covers, latches, or interlocks that stop the fan when panels are removed. Propping these open or modifying them for easier access exposes internal parts to dust and physical damage, and can also be a safety risk.

During cleaning, open only the panels meant to be user-removable. Close and secure them fully before operating the purifier again.

Ionizers, UV-C, and other add-ons

Some purifiers include optional features like ionizers or UV-C lamps. From a cleaning standpoint, it is generally best not to disturb or wipe these components unless the manual gives specific instructions. Touching or bending such parts can alter how they operate.

As with sensors, dry dust removal around these areas, without direct contact or liquids, is safer than detailed internal cleaning attempts.

Electrical and moisture safety

Mixing electricity and moisture is always a concern. Keep all liquid-based cleaning to external, unplugged surfaces, and wring out cloths thoroughly before use. Avoid letting any fluid run into seams, buttons, vents, or sensor openings.

Maintenance Timing and Cost Planning for Long-Term Performance

Routine, gentle maintenance often costs less over time than letting dust accumulate and then resorting to aggressive cleaning. Planning ahead for filter replacements and light cleaning sessions helps keep sensors and intakes effective without last-minute fixes.

Aligning cleaning with filter checks

A practical approach is to align intake and sensor checks with filter inspections or replacements. Each time you look at the filters, quickly inspect the intake area and sensor inlet for visible dust and address it gently if needed.

Balancing cleaning and replacement

Filters, especially fine particle filters and carbon layers, have a limited capacity. Over-cleaning some filter types can damage fibers or reduce performance. It is better to replace filters on a reasonable schedule than to try to extend their life indefinitely with intense cleaning that might shed fibers into sensors or the fan.

Many households find that pre-filters can be gently vacuumed or rinsed (only if the manual allows it), while main filters are simply replaced when indicated by hours of use, visible discoloration, or manufacturer guidance.

Table 2. Example air purifier filter replacement planning – Example values for illustration.
Filter replacement planner and what affects timing
Filter type Typical interval range (example) What changes it Reminder
Washable pre-filter Every 1–3 months for cleaning Pet hair, visible dust load, smoking indoors Let fully dry before reinstalling to protect sensors.
Non-washable pre-filter Every 3–12 months for replacement Dusty homes, nearby roads, frequent door opening Do not soak or wash if not designed for it.
HEPA or similar fine filter Every 6–24 months Fan speed usage, local wildfire smoke, indoor activities Avoid aggressive vacuuming that may release fibers.
Activated carbon filter Every 3–12 months Cooking odors, nearby traffic, indoor chemicals Do not wash unless manual states it is washable.
Combined filter cartridges Every 6–18 months Operating hours, fan level, room dust levels Replace as a unit rather than separating layers.
Internal foam or gaskets Inspect yearly Age, repeated cleaning, chemical exposure Do not trim or glue; seek proper replacements.

Example values for illustration.


Related guides: Air Purifier Maintenance Checklist: Filters, Sensors, and CleaningAir Purifier Placement: Where to Put It for Best ResultsHow Often Should You Replace a HEPA Filter?

Summary: Simple Rules for Cleaning Sensors and Intakes Safely

Careful cleaning of air purifier sensors and intakes supports airflow and more stable operation without shortening the life of delicate parts. The main risks come from liquids, strong air pressure, harsh tools, and attempts to reach internal sensor components that were not meant for user access.

By unplugging the purifier before cleaning, using soft and dry tools on sensor areas, keeping liquids away from vents, and replacing filters on a sensible schedule, most households can maintain their purifiers effectively. Observing how the unit behaves over time—fan noise, airflow at the intake, and any available indicators—can guide when a light cleaning is needed, without resorting to steps that might do more harm than good.

Frequently asked questions

How do I clean a particle or PM sensor inlet without causing damage?

Unplug the purifier and use a small, soft, dry brush to loosen dust around the sensor inlet, then gently tap or blow across the opening from a short distance. Do not insert objects into the inlet, touch sensor windows, or apply liquids unless the manual explicitly permits it.

Is it safe to use compressed air or a vacuum on intake grilles?

Avoid high-pressure compressed air since it can force dust deeper into the unit; if you use canned air, apply short, gentle bursts from a distance. For vacuuming, use a brush attachment and keep the nozzle a few inches away to prevent bending fins or dislodging parts.

Can I run the purifier without filters to “blow out” dust?

No. Running the purifier without filters can send unfiltered dust into the fan and sensor chambers, increasing contamination and potentially causing lasting issues. Always operate the unit with properly installed filters and clean externally instead.

Which household cleaners are safe near intakes and sensors?

Use a lightly damp microfiber cloth with mild soap for external housings and keep any moisture away from vents and inlets. Avoid alcohol, solvents, and strong chemicals on or near sensor openings unless the manufacturer’s manual explicitly allows them.

How often should I check and lightly clean sensors and intake areas?

Inspect and lightly clean intakes and sensor inlets every 1–3 months as a general guideline, with more frequent checks in homes with pets, heavy dust, or frequent cooking. Coordinating these checks with filter inspections helps catch buildup early.

Filter Replacement Schedules for HEPA, Carbon, and Pre-Filters Explained

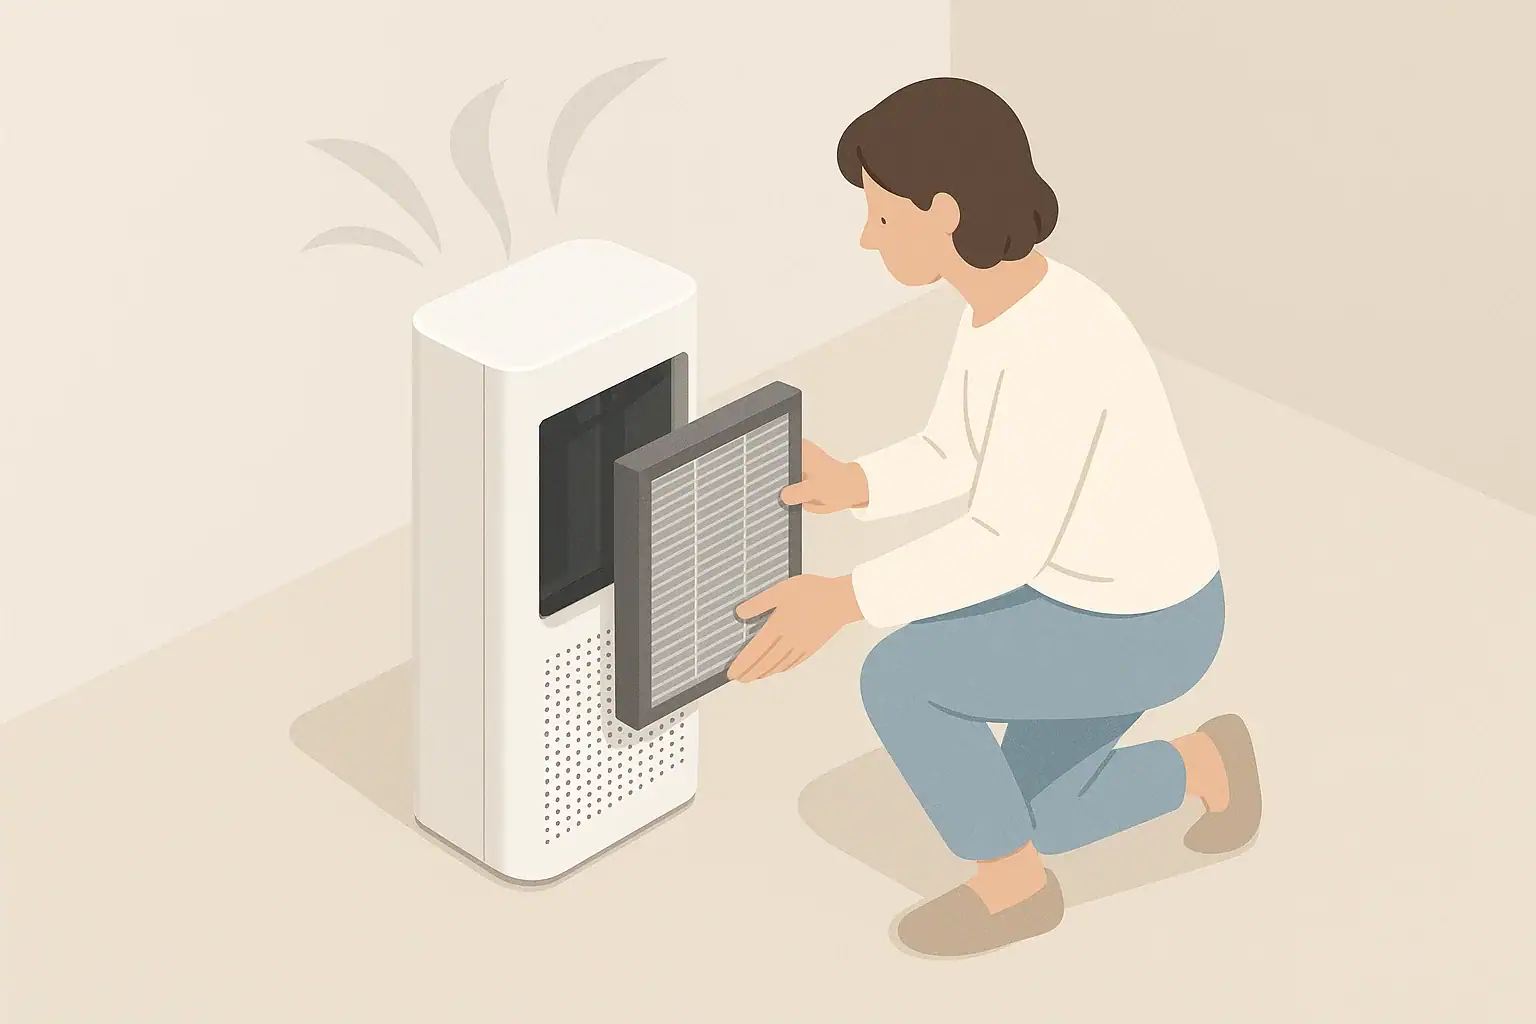
Person removing air purifier filter for replacement

Filter replacement schedules for HEPA, carbon, and pre-filters are based on typical time ranges, visible wear, and changes in airflow or odor, rather than one fixed rule for every home.

Indoor air and usage patterns differ from home to home, so manufacturer guidance is only a starting point. You can refine your schedule by watching for reduced airflow, more dust on surfaces, and lingering smells. This article explains typical ranges and simple checks so you can plan replacements without guessing or wasting filters.

Quick answer
  • HEPA filters: often about 12–18 months of use, shorter (6–12 months) in dusty or smoky conditions.
  • Carbon filters: commonly 6–12 months, or sooner if odors return or VOC sources are constant.
  • Pre-filters: clean every 2–4 weeks and replace 3–6 months, depending on dust and pet hair.
  • Continuous 24/7 operation usually shortens all filter lifespans compared with occasional use.
  • Watch for signs: reduced airflow, more dust buildup, or persistent odors despite running the purifier.

What Filter Replacement Schedules Mean and Why They Matter

Filter replacement schedules are guidelines for how long HEPA, carbon, and pre-filters can reasonably perform before their efficiency or airflow drops. They are not strict expiration dates but practical planning tools.

In a typical home, filters gradually load with particles and gases. As this happens, two things change:

  • Airflow resistance increases, so the purifier may move less air and become noisier on higher speeds.
  • Filtration capacity decreases, especially for gas and odor filters that rely on limited adsorption sites.

Replacing filters on an appropriate schedule helps you keep:

  • More consistent particle reduction (dust, smoke, pet dander).
  • More consistent odor/VOC reduction when carbon is present.
  • Reasonable energy use and noise, because the fan does not have to work as hard to push air through clogged media.

A schedule is most useful when it combines the manufacturer’s time estimate with what you observe in your actual environment.

Key Concepts: HEPA, Carbon, and Pre-Filters Explained

Understanding the job of each filter stage makes it easier to decide when to clean or replace it.

HEPA filters: fine particle workhorse

“True HEPA”HEPA (High Efficiency Particulate Air) filters are dense fiber media designed to capture fine particles such as dust, smoke, and many airborne allergens. In consumer air purifiers, you may see “True HEPA” or grades like H13 or H14, which indicate high capture efficiency for small particles under standardized test conditions.

Key points for replacement:

  • HEPA filters do not usually wash well; water or detergents can damage fibers or create paths where air bypasses the media.
  • They slowly load with particles, increasing resistance and making fans work harder over time.
  • Typical replacement guidance in homes is about 12–18 months, with shorter intervals in heavy-use or high-pollution situations.

Carbon filters: odor and VOC reduction

Activated carbon filters use a porous carbon material to adsorb many odor-causing molecules and some volatile organic compounds (VOCs). Their capacity is finite: once filled, they no longer significantly reduce odors or certain gases.

Key points for replacement:

  • Performance depends strongly on gas concentration, airflow rate, and carbon amount in the filter.
  • Once saturated, carbon will not work effectively, even if it still looks clean.
  • Many homes benefit from replacing carbon filters every 6–12 months, or when odors return more quickly after running the purifier.

Pre-filters: first line of defense

Pre-filters are coarse filters or screens that capture larger particles such as hair, lint, and larger dust before they reach the HEPA and carbon stages. They protect the more expensive filters and help maintain airflow.

Key points for replacement or cleaning:

  • Many pre-filters are designed to be washed or vacuumed regularly.
  • Heavily loaded pre-filters can sharply reduce airflow, even if HEPA and carbon are still usable.
  • Typical routine: check and clean every 2–4 weeks, replace every 3–6 months or when damaged or permanently discolored.
Comparison of HEPA, carbon, and pre-filters by function and replacement focus. Example values for illustration.
Filter type Main job Typical focus for replacement Example home interval range
HEPA Fine particles (dust, smoke, pollen) Airflow resistance and visible loading About 12–18 months
Activated carbon Odors and some VOCs Odor breakthrough and hours of use About 6–12 months
Pre-filter (washable) Hair, lint, coarse dust Visual dust buildup Clean every 2–4 weeks
Pre-filter (replaceable) Hair, lint, coarse dust Clogging or damage About 3–6 months
Combination HEPA/carbon Particles and odors in one piece Balance between airflow and odor control About 9–15 months
Specialty gas filter Specific gases (e.g., higher VOC loads) Change in odor or irritation cues Highly variable by use

Example values for illustration.

Common Mistakes and Signs Filters Need Attention

Many homeowners either change filters too late, reducing effectiveness, or far too early, increasing costs. Recognizing common mistakes can help you avoid both extremes.

Relying only on the calendar

Calendar schedules (for example, “replace every 12 months”) are convenient but ignore real-world variation. A purifier running 24/7 near a busy road may load a HEPA filter much faster than one used a few hours a day in a relatively clean environment.

Use the calendar as a starting point, but adjust for:

  • Daily run time and fan speed settings.
  • Number of occupants and pets.
  • Indoor activities such as cooking, smoking, or frequent use of sprays and cleaners.
  • Outdoor air quality, especially wildfire smoke or nearby traffic.

Ignoring reduced airflow and rising noise

If the airflow feels weaker on the same fan setting compared with when the filter was new, or the purifier sounds like it is working harder, resistance may be increasing. A heavily loaded HEPA or pre-filter forces the fan to push against more backpressure.

Signs connected to airflow issues include:

  • Dust staying in the air longer than before, even at the same setting.
  • Needing to use a higher fan speed to get similar room freshness.
  • Uneven air discharge from vents or grills due to partial clogging.

Expecting carbon to remove all smells indefinitely

Carbon filters do not have a visual cue for saturation, and they cannot remove every possible odor or gas. Once the adsorption sites are filled, additional operation will not significantly improve odor reduction, even if the filter looks clean and airflow is fine.

Typical signs to pay attention to include:

  • Cooking or pet odors linger longer than they did shortly after installing a fresh carbon filter.
  • Odors reappear soon after turning off the purifier, suggesting limited gas capacity.
  • You need to run the purifier on higher speeds more often to get noticeable odor reduction.

Practical Filter Replacement Guidance and Checklist

A simple routine helps keep your filter schedule predictable and cost-aware while avoiding unnecessary replacements.

Monthly quick checks

  • Inspect the pre-filter: Look for hair mats, lint layers, or visible dust coating. Clean or wash if allowed.
  • Check airflow by feel: Place your hand near the outlet at a known fan setting and note whether it feels weaker than you remember.
  • Scan for dust on nearby surfaces: If you are seeing more dust settling despite similar use, filtration may be declining.

Quarterly deeper checks (every 3 months)

  • Open the unit safely: With power off and unplugged, remove the front or rear panel as directed in the manual.
  • Visually inspect the HEPA filter: Look for significant gray or dark loading, patched clogs, or damage to pleats and gaskets.
  • Inspect the carbon filter: Note any discoloration, dust buildup on the surface, or musty smell coming from the filter itself.
  • Clean the housing: Wipe accessible inner surfaces with a dry or lightly damp cloth to remove dust that might bypass filters.

Yearly planning

Once a year, estimate how many hours your purifier has run and at what settings. Many households find it helpful to:

  • Replace HEPA filters about once a year in moderate conditions, sooner in heavy use.
  • Replace carbon filters once or twice a year, depending on odor load.
  • Budget for a full filter set in advance to avoid delaying replacements.

Real-World Example Schedules for Different Homes

These scenarios show how the same filters might reasonably be replaced on different timelines, based on use and environment. They are examples, not strict rules.

Small apartment, light use

A single person in a small apartment runs a purifier on low for 8 hours a day, with no pets and limited cooking.

  • Pre-filter: quick vacuum every month, replace every 6 months if not washable.
  • HEPA: likely usable for 15–18 months, with airflow checks at 12 months.
  • Carbon: 9–12 months, or earlier if odor control noticeably declines.

Family home with pets

A family of four with two shedding pets runs a purifier 16–24 hours per day near common areas.

  • Pre-filter: clean every 2 weeks; replacement around every 3–4 months if non-washable.
  • HEPA: 9–12 months, potentially sooner if visibly loaded with hair and fine dust.
  • Carbon: 6–9 months, especially if used for pet odor control.

Seasonal wildfire smoke

A home in an area with seasonal wildfire smoke boosts purifier use during smoke events, often running on higher speeds.

  • During smoke season: check pre-filters weekly; they can load quickly.
  • HEPA: may require replacement after a single severe season if heavily darkened and airflow drops.
  • Carbon: often benefits from replacement after the smoke season to restore odor and gas capacity.

Safety, Standards, and What Not to Do

Safe filter replacement is as important as staying on schedule. Follow the purifier manufacturer’s instructions and consider these general points:

  • Power off and unplug before opening the unit or handling filters.
  • Avoid washing non-washable filters: Moisture can damage HEPA fibers or promote unwanted microbial growth inside the media.
  • Do not modify filters (cutting, taping together unrelated media, or using improvised materials) in ways the product was not designed for.
  • Replace seals or gaskets if they are damaged, since leakage around a filter can allow air to bypass the media.

Some purifiers include optional technologies such as ionizers or UV-C lamps. If present, review the manual on how they interact with filters and how often lamp components should be replaced. If you prefer to avoid these features, many devices allow you to switch them off while still using mechanical filtration.

Maintenance, Costs, and Long-Term Planning

Planning ahead for filter maintenance helps smooth out costs and avoids long periods of reduced performance.

Budgeting for filter replacements

Different models use different filter sizes and combinations. In general:

  • Estimate how many full sets of filters you will use per year (for example, one HEPA and two carbon filters).
  • Remember the pre-filter cost if it is not washable or not intended to last the life of the unit.
  • Account for heavier use seasons, such as wildfire season or high-pollen months, that may shorten intervals.

Coordinating with other home air strategies

Filters are one part of indoor air quality. Using them alongside other simple approaches can reduce how hard your filters have to work:

  • Source control: Reduce smoke, candles, and heavy use of sprays indoors where practical.
  • Ventilation: When outdoor air is reasonable, brief ventilation can dilute indoor pollutants.
  • Humidity control: Keeping indoor humidity in a moderate range can help limit dust clumping and moisture-related issues.

Using indicators and air quality monitors

Some purifiers include filter-change indicator lights based on run time or airflow estimates. Treat these as prompts, not absolute rules. You can:

  • Inspect the filter when the indicator activates and decide whether to replace immediately or schedule it soon.
  • Use a simple PM2.5 monitor, if you have one, to see whether particle levels drop as expected when the purifier is on; a persistent lack of improvement may suggest filters are overdue or the unit is undersized.

Filter Replacement FAQs

Can I vacuum a HEPA filter instead of replacing it?

Some HEPA filters allow gentle surface vacuuming to remove loose dust, but this usually does not restore original performance and may damage delicate fibers if done aggressively. Always check the manual. Even if vacuuming is permitted, plan on regular replacement within a typical time range.

How do I know if a pre-filter is still working after washing?

If a washed pre-filter holds its shape, has no tears, and air passes through it easily, it is probably still functioning as intended. If it becomes misshapen, stiff, or starts to fray, it may be time to replace it to avoid bypass or uneven airflow.

Is it better to replace HEPA and carbon at the same time?

Many homeowners replace both together for convenience, especially when they are combined in one cartridge. If the filters are separate, you can sometimes replace carbon more often than HEPA, particularly when odor control is a priority. Aligning replacements can make budgeting and tracking simpler.

What if I rarely use my purifier?

If the purifier runs only occasionally, filters load more slowly. However, dust can still settle on media over time, and some materials may age. A reasonable approach is to inspect at least annually, and replace if the filters look heavily loaded, damaged, or have been installed for several years, even with low run time.

Do more expensive filters always last longer?

Higher cost can reflect more media area or specialty materials, but price alone does not guarantee longer life. Lifespan mainly depends on design, how much media is present, and how challenging your indoor environment is. Use the recommended intervals, visible condition, and your air quality observations together to decide.

Example planner for HEPA, carbon, and pre-filter replacement timing. Example values for illustration.
Filter type Typical interval range What changes it most Reminder idea
HEPA About 12–18 months Hours of use, smoke or dust events Annual calendar reminder plus smoke-season check
Carbon About 6–12 months Cooking, pets, chemical odors Replace when odors linger despite normal use
Washable pre-filter Clean every 2–4 weeks Pet hair, visible dust buildup Monthly cleaning note on calendar
Replaceable pre-filter About 3–6 months Shedding pets, vacuuming frequency Coordinate with seasonal house cleaning
Combined HEPA/carbon cartridge About 9–15 months Odor load and fine particles together Replace when airflow drops or odor control weakens
Specialty gas filter Highly variable Specific VOC sources and run time Follow manufacturer guidance plus odor cues

Example values for illustration.


Related guides: How Often Should You Replace a HEPA Filter?When to Replace Carbon Filters (And How to Tell They’re Spent)Filter Replacement Cost Calculator: Annual HEPA + Carbon Budget

Summary: Building a Filter Schedule That Fits Your Home

Effective filter replacement schedules combine general time ranges with what you observe in your living space. HEPA filters usually last around a year or more in typical homes, carbon filters often benefit from being replaced at least annually for consistent odor control, and pre-filters need frequent cleaning to protect the more expensive stages.

By checking airflow, watching for dust and odors, and planning ahead for costs, you can keep your HEPA, carbon, and pre-filters working steadily without over-replacing them. Over time, you will learn how quickly filters load in your specific home and can fine-tune the schedule to match your air quality needs and usage patterns.

Frequently asked questions

How often should I replace HEPA filters if I have shedding pets?

If you have shedding pets and run the purifier most of the day, expect to replace HEPA filters closer to 9–12 months; in heavy hair or dust conditions check at 6–9 months. Regularly cleaning the pre-filter every 1–2 weeks helps extend HEPA life by removing hair before it reaches the HEPA stage.

Can I wash or vacuum an activated carbon filter to restore odor removal?

No — washing or vacuuming carbon rarely restores adsorption capacity because odor removal depends on internal adsorption sites rather than surface dust. Light surface vacuuming may remove dust but will not recharge the carbon; replace carbon filters when odor breakthrough occurs.

What signs indicate a carbon filter is saturated even if it looks clean?

Typical signs include cooking, pet, or smoke odors returning sooner than when the filter was new and needing higher fan speeds to get the same odor reduction. Because carbon saturation has no clear visual cue, use odor persistence and reduced odor-control performance as triggers for replacement.

How should I maintain pre-filters during seasonal wildfire smoke events?

During smoke events check and clean washable pre-filters weekly because they can load quickly with soot and ash; non-washable pre-filters may need replacement every few weeks. Inspect HEPA and carbon after the season—HEPA may darken and carbon can lose capacity—so plan post-season replacements as needed.

Is it okay to replace HEPA and carbon filters at different intervals?

Yes. If the purifier uses separate cartridges, you can replace carbon more frequently for odor/VOC control while keeping HEPA until airflow resistance indicates it’s time; replacing both together is convenient but not required.

Air Purifier Maintenance Checklist Without Guessing

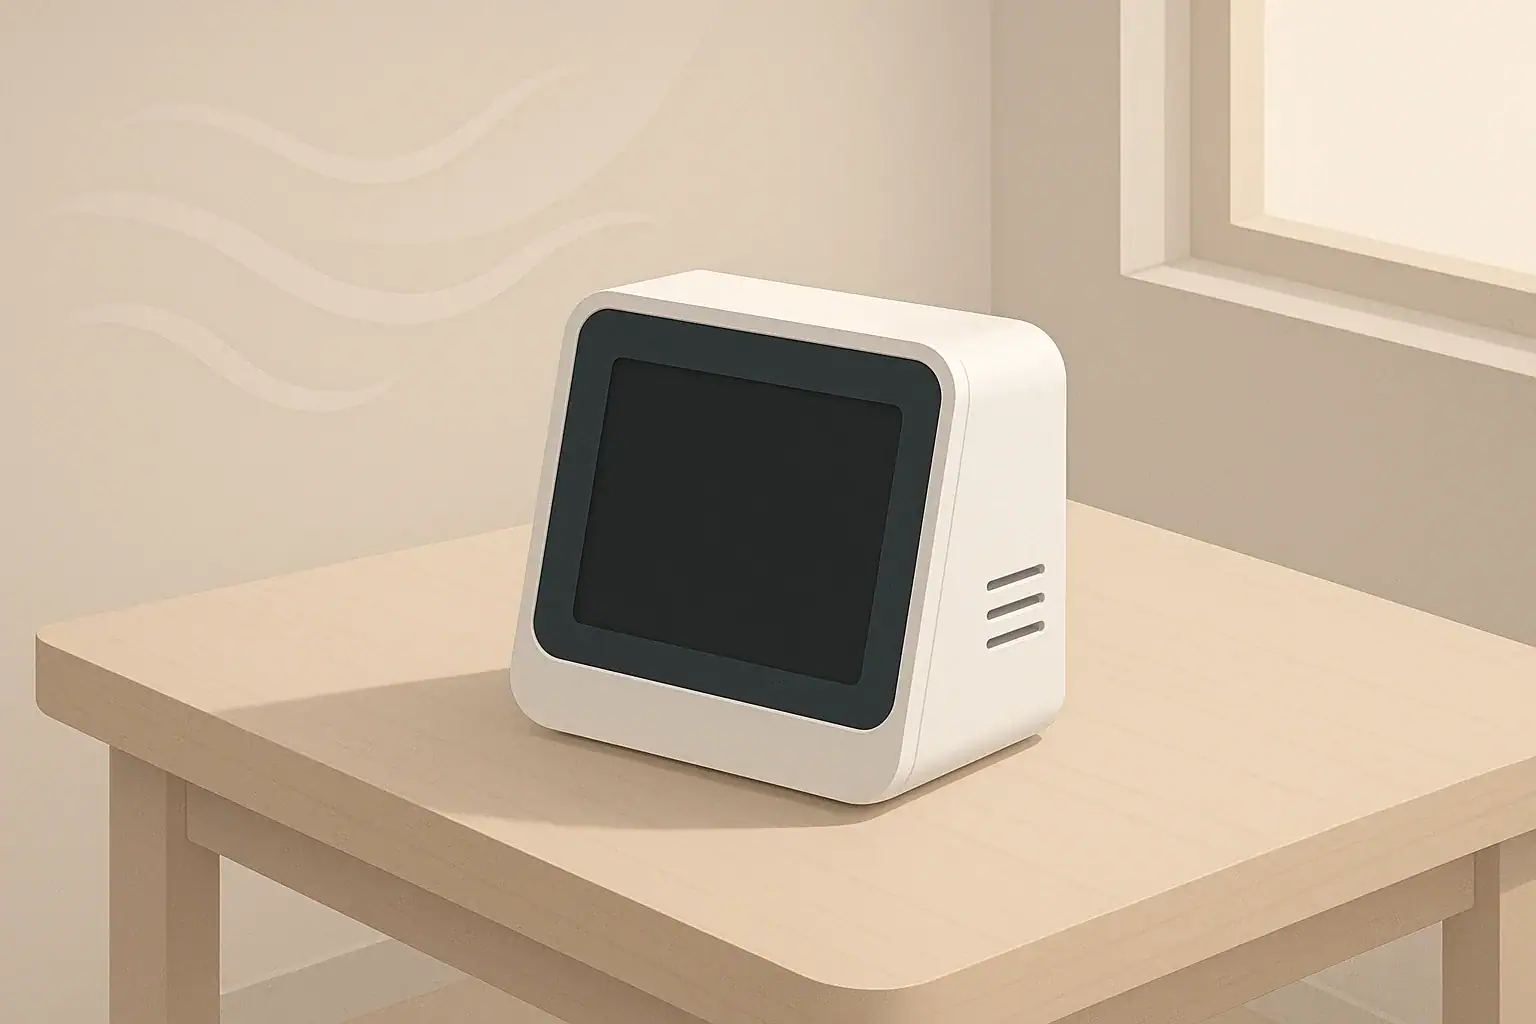
Person removing air purifier filter in a tidy modern room

An air purifier maintenance checklist breaks routine care into monthly and seasonal tasks so your unit keeps moving air effectively and filters work as designed.

Most modern purifiers are simple to own, but they do need regular cleaning and filter checks. A basic schedule helps you avoid restricted airflow, unnecessary noise, and wasting energy by running clogged filters for too long.

Quick answer
  • Check pre-filters every 2–4 weeks and vacuum or rinse if they are visibly dusty (only if the manual allows rinsing).
  • Inspect main HEPA filters about every 1–3 months and replace when airflow drops, they look heavily discolored, or the filter indicator says to.
  • Replace odor/activated carbon filters roughly every 3–12 months, depending on smoke, cooking, and pet odors.
  • Wipe exterior grills and nearby surfaces monthly to keep dust from re-entering the air stream.
  • Do a deeper seasonal check 2–4 times per year: vacuum intake/exhaust grills, verify placement, and review your filter replacement dates.

Why Air Purifier Maintenance Matters

Air purifiers move air through filters, so anything that blocks airflow or bypasses the filter reduces their usefulness. Dust buildup on pre-filters, clogged HEPA media, or a worn-out carbon filter can leave the unit running but not doing much for particle or odor reduction.

Regular maintenance supports three practical goals:

  • Stable airflow: Clean intakes and filters let the fan move air through the room more predictably.
  • Consistent filtration performance: A well-sealed, not-overloaded filter helps capture particles along the designed airflow path.
  • Reasonable noise and energy use: A clogged filter makes the fan work harder, which can increase sound levels and power draw.

Instead of waiting for problems, a simple checklist keeps tasks small and predictable so you can plan filter costs and avoid guesswork.

Key Parts of an Air Purifier and What They Do

Most common residential air purifiers share a few basic components. Understanding each part helps you know what to inspect and how often.

Pre-filter

The pre-filter is usually the first layer behind the intake grill. It catches larger particles such as hair, lint, and coarse dust before they reach the main filter. Many pre-filters are washable or vacuumable, which makes them a key focus of monthly maintenance.

HEPA or high-efficiency particle filter

This is the main fine-particle filter. It may be labeled HEPA, True HEPA, or with classes like H13 or H14. These filters are not typically washable; water or aggressive cleaning can damage the fibers or seals. They generally need replacement every several months to a couple of years, depending on use, room conditions, and design.

Activated carbon or gas filter

An activated carbon or similar media filter helps reduce certain odors and some gases, including many cooking and smoke smells. These filters can saturate long before they look dirty. If you notice odors returning more quickly, it can be a sign the carbon media is exhausted and ready to replace.

Housing, seals, and grills

The plastic or metal shell, access doors, and gaskets keep air moving through the filter instead of around it. Dust on grills and poor seals can allow bypass, where air skips the filter layers. Wiping surfaces and checking that panels close fully is a simple but important part of seasonal maintenance.

Table 1. Air purifier maintenance checklist by component. Example values for illustration.
Key tasks, why they matter, and simple notes
Component Task Why it matters Notes
Pre-filter Vacuum or rinse (if allowed) Prevents early clogging of main filter Check every 2–4 weeks for visible dust
HEPA filter Inspect and replace as needed Maintains fine particle capture Do not wash unless manual clearly allows
Carbon filter Replace periodically Helps with cooking and smoke odors More frequent changes in heavy odor use
Intake/exhaust grills Dust and wipe Keeps airflow paths open Include nearby surfaces and floor area
Seals and doors Check fit and close fully Reduces unfiltered air bypass Re-seat filter if door will not close smoothly
Fan and interior cavity Light vacuum if accessible Limits internal dust buildup Only where manufacturer permits access
Sensors and indicators Wipe sensor openings gently Helps auto modes respond more consistently Avoid liquids directly on sensor area

Example values for illustration.

Common Maintenance Mistakes and Early Warning Signs

Many air purifiers keep running even when filters are clogged or expired. Knowing typical missteps and what to watch for can keep you ahead of issues.

Overrelying on filter change lights

Filter indicator lights are helpful, but they often rely on run-time estimates rather than measuring filter condition directly. If your environment is dusty or you run the unit on higher speeds for long periods, you may need to change filters sooner than the light suggests.

Washing filters that are not designed to be washed

Some filters look like they might survive a rinse, but water or detergent can damage fibers, reduce filtration efficiency, or affect coatings. Only wash filters if the instructions explicitly say that they are washable. Otherwise, limit yourself to gentle surface vacuuming if recommended.

Ignoring airflow and noise changes

Changes in sound and air movement are practical clues:

  • Quieter but weak airflow: The fan might be struggling against a clogged filter while moving less air.
  • Louder on the same setting: The fan may be working harder to push through a dirty filter or blocked intake grill.

If a favorite fan speed no longer moves as much air as before, inspect filters even if the indicator has not lit up.

Forgetting seasonal shifts

Indoor air changes across the year. Pollen seasons, wildfire smoke episodes, extended cooking during holidays, or closed-window winter periods may each add extra load on filters. If your local conditions change, your maintenance schedule likely should too.

Monthly Air Purifier Maintenance Checklist

Monthly tasks are about keeping airflow unobstructed and dust under control. These steps are quick once you are familiar with your purifier’s layout.

1. Power down safely

  • Turn the purifier off and, if you will open the housing, unplug it first.
  • Let any fan blades stop completely before reaching inside.

2. Clean or check the pre-filter

  • Open the access panel and locate the pre-filter layer.
  • If it is visibly dusty, follow the manual: vacuum with a brush attachment or rinse with water if allowed.
  • Allow any rinsed filter to dry fully before reinstalling to avoid moisture in the housing.

3. Inspect the main HEPA filter (without forcing it)

  • Check for heavy discoloration, uneven dark patches, or obvious dust mats on the surface.
  • If the filter looks heavily loaded or air seems restricted, plan for a replacement even if you have not reached the nominal time interval.
  • Do not poke or compress the filter media; that can damage fibers and seals.

4. Wipe grills and housing

  • Use a slightly damp cloth or microfiber towel to wipe intake and exhaust grills.
  • Dust the top and sides of the unit and the floor immediately around it.
  • Avoid getting moisture into electronics, control panels, or sensor openings.

5. Check placement and clearance

  • Confirm there is at least several inches of space (often 6–12 inches as general guidance) around intake and exhaust areas.
  • Move the unit away from piles of clothing, curtains, or furniture that might block airflow.
  • If the purifier was nudged behind a chair or table, reposition it for better room circulation.

6. Confirm settings and timers

  • Review whether the fan speed matches your current needs (for example, higher during pollen or smoke events, lower when air is cleaner).
  • Check that sleep or timer modes are still aligned with when you occupy the room.

Seasonal and Deep-Clean Tasks

Seasonal tasks, done a few times a year, involve more thorough checks and often coincide with heavier filter changes. Many people align these with the start of spring, summer, fall, and winter, or with local events such as wildfire season.

1. Replace HEPA and carbon filters as needed

  • Review how many months the filter has been in use and compare this with the manufacturer’s general interval guidance.
  • Consider your use pattern: near a busy road, in a smoking or cooking-intensive household, or with multiple pets usually means shorter intervals.
  • Write the installation date on the filter frame or in a simple log so you can track age at a glance.

2. Vacuum interior cavities where accessible

  • With the unit unplugged and filters removed, gently vacuum the accessible interior surfaces using a soft brush attachment.
  • Avoid disturbing wiring, fan blades, or any components the manual describes as non-user-serviceable.

3. Clean sensor inlets

  • If your purifier has particle or gas sensors, locate the small inlets or windows indicated in the manual.
  • Wipe around these openings carefully with a dry, soft cloth.
  • A lightly dusted sensor is more likely to respond consistently in auto modes.

4. Reevaluate room placement by season

  • In heating seasons with closed windows, focusing on bedrooms or main living areas may give more benefit per hour of run-time.
  • During higher-pollen or smoke periods, moving the unit closer to entryways or windows can help address incoming air, as long as grills are not obstructed.
  • For open-plan spaces, consider whether one large unit or two smaller units placed apart serve the space better.

5. Review overall run-time and energy habits

  • Look at how many hours per day you actually run the purifier at different speeds.
  • If you are running continuously on high, you may accept more frequent filter changes and plan accordingly.
  • If you prefer to limit energy use, moderate speeds run longer can be a reasonable compromise in many homes.

Real-World Maintenance Scenarios

Turning the checklist into habits is easier with practical examples. These scenarios are generalized; your exact conditions may differ.

Small bedroom, light dust, no pets

  • Monthly: Quick pre-filter check, wipe exterior, confirm placement away from walls and bedding.
  • Seasonal: Inspect HEPA filter, likely replace every 9–18 months depending on hours of use; replace carbon filter if odors linger.

Apartment with pets and frequent cooking

  • Monthly: Clean pre-filter; wipe hair and dust from intake; check that the exhaust is not blowing directly onto surfaces where dust accumulates.
  • Seasonal: Replace carbon filter more often (for example, 3–6 month intervals) and inspect HEPA filter at each season change.

Home in an area with seasonal wildfire smoke

  • Before smoke season: Install fresh HEPA and carbon filters; ensure you have spares on hand.
  • During heavy smoke: Run on higher speeds as needed, knowing this will use filter life more quickly.
  • After season: Inspect filters; consider replacing if they show heavy discoloration or odors, even if they are not at the end of the nominal time interval.

Safety, Ozone, and Add-On Features

Some air purifiers include optional features such as ionizers or UV-C lamps. Maintenance for these should prioritize safety and manufacturer instructions.

Ionizers and ozone considerations

  • Home air cleaning generally focuses on mechanical filtration (HEPA and carbon) that does not intentionally create ozone.
  • If your purifier has an ion or plasma mode, use any available settings designed to limit byproducts, and follow the manual for recommended operation.
  • Do not attempt to modify internal circuits, disable safety interlocks, or operate a unit with damaged electrical components.

UV-C lamps and similar components

  • Some systems include UV-C lamps or other internal sanitizing components with set replacement intervals.
  • Follow the manual precisely for access and replacement; UV light can be hazardous to eyes and skin if shielding is bypassed.
  • Never operate the unit with panels open or safety covers removed.

Electrical and placement safety

  • Use properly grounded outlets and keep cords out of walkways.
  • Avoid placing purifiers where they can tip easily or where water spills are likely, such as directly beside bathtubs or wet floors.
  • If you notice unusual smells, rattling, or heat from the housing, turn the unit off and consult the manual or a qualified service resource.

Filter Life Planning and Cost Expectations

Filters are the main ongoing cost of owning an air purifier. Treating maintenance as a predictable schedule rather than an emergency replacement can help you budget and avoid running expired filters for long periods.

Factors that shorten filter life

  • High fan speeds or 24/7 operation
  • Homes with multiple pets, heavy shedding, or visible dust accumulation
  • Frequent frying, grilling, or high-odor cooking
  • Nearby traffic, industrial sources, or recurring smoke episodes

Simple tracking methods

  • Write filter install dates on a small label or on the filter frame.
  • Set calendar reminders for mid-range replacement dates, adjusting earlier or later as you observe performance.
  • Keep a short note on approximate hours of daily use and typical fan speeds.
Table 2. Example filter replacement planner. Example values for illustration.
Typical ranges and what can change them
Filter type Typical interval range (example) What shortens the interval Reminder tip
Washable pre-filter Clean every 2–4 weeks Heavy dust, pets, open windows Link cleaning to monthly house cleaning
Non-washable pre-filter pad Replace every 3–6 months Frequent vacuuming or visible clogging Inspect each season and change when dark
Standard HEPA filter 6–24 months High-speed use, smoke events Check at 6 months, then adjust frequency
High-capacity HEPA cassette 12–36 months Continuous operation in dusty rooms Note installation year on the cassette
Activated carbon panel 3–12 months Cooking, pets, tobacco or wildfire smoke Replace when odors return sooner than before
Specialty gas filter Varies by design Ongoing chemical or odor exposure Follow manual; log replacement date carefully

Example values for illustration.


Related guides: Air Purifier Placement: Where to Put It for Best ResultsWhen to Replace Carbon Filters (And How to Tell They’re Spent)Filter Replacement Cost Calculator: Annual HEPA + Carbon Budget

Summary: Turning Maintenance Into a Simple Routine

An air purifier maintenance checklist is mostly about a few repeatable habits: keeping pre-filters clean, replacing HEPA and carbon filters on a realistic schedule, wiping dust from grills, and occasionally checking placement and settings. By pairing monthly quick checks with deeper seasonal reviews, you can keep airflow steady, avoid overworking the fan, and plan filter purchases instead of reacting to unexpected clogs or returning odors.

Frequently asked questions

How often should I check and clean the pre-filter on a monthly and seasonal maintenance schedule?

Check pre-filters every 2–4 weeks as part of monthly maintenance; vacuum or rinse them only if the manual allows and always let rinsed filters dry completely before reinstalling. During seasonal deep-cleans, inspect the pre-filter for wear and replace non-washable pads when they appear dark or clogged.

When should I replace the main HEPA filter as part of a monthly and seasonal maintenance checklist?

Inspect the HEPA filter monthly for heavy discoloration, dust mats, or reduced airflow and plan replacements during seasonal checks as needed. Typical replacement ranges are roughly 6–24 months depending on usage and local conditions, and you should replace sooner after smoke events or continuous high-speed operation.

How can I tell if the activated carbon or odor filter needs replacing?

Noticeable return of cooking, smoke, or pet odors, reduced odor removal performance, or a saturated-looking media are signs the carbon filter is exhausted. Carbon filters commonly require replacement every 3–12 months depending on odor exposure and household activities.

What specific seasonal and deep-clean tasks should I schedule 2–4 times per year?

Seasonal tasks include replacing HEPA and carbon filters as needed, vacuuming accessible interior cavities, gently cleaning sensor inlets, checking housing seals and access panels, and reevaluating room placement. Also review run-time habits and order spare filters ahead of known high-demand periods like pollen or wildfire seasons.

Is it safe to wash HEPA filters, or should I only vacuum them during maintenance?

Most HEPA and fine-particle filters are not washable; exposing them to water or detergents can damage fibers and seals and reduce filtration efficiency. Only wash filters if the manufacturer explicitly states they are washable—otherwise use gentle surface vacuuming where recommended.

VOC Monitor Limitations: Why TVOC Often Misleads

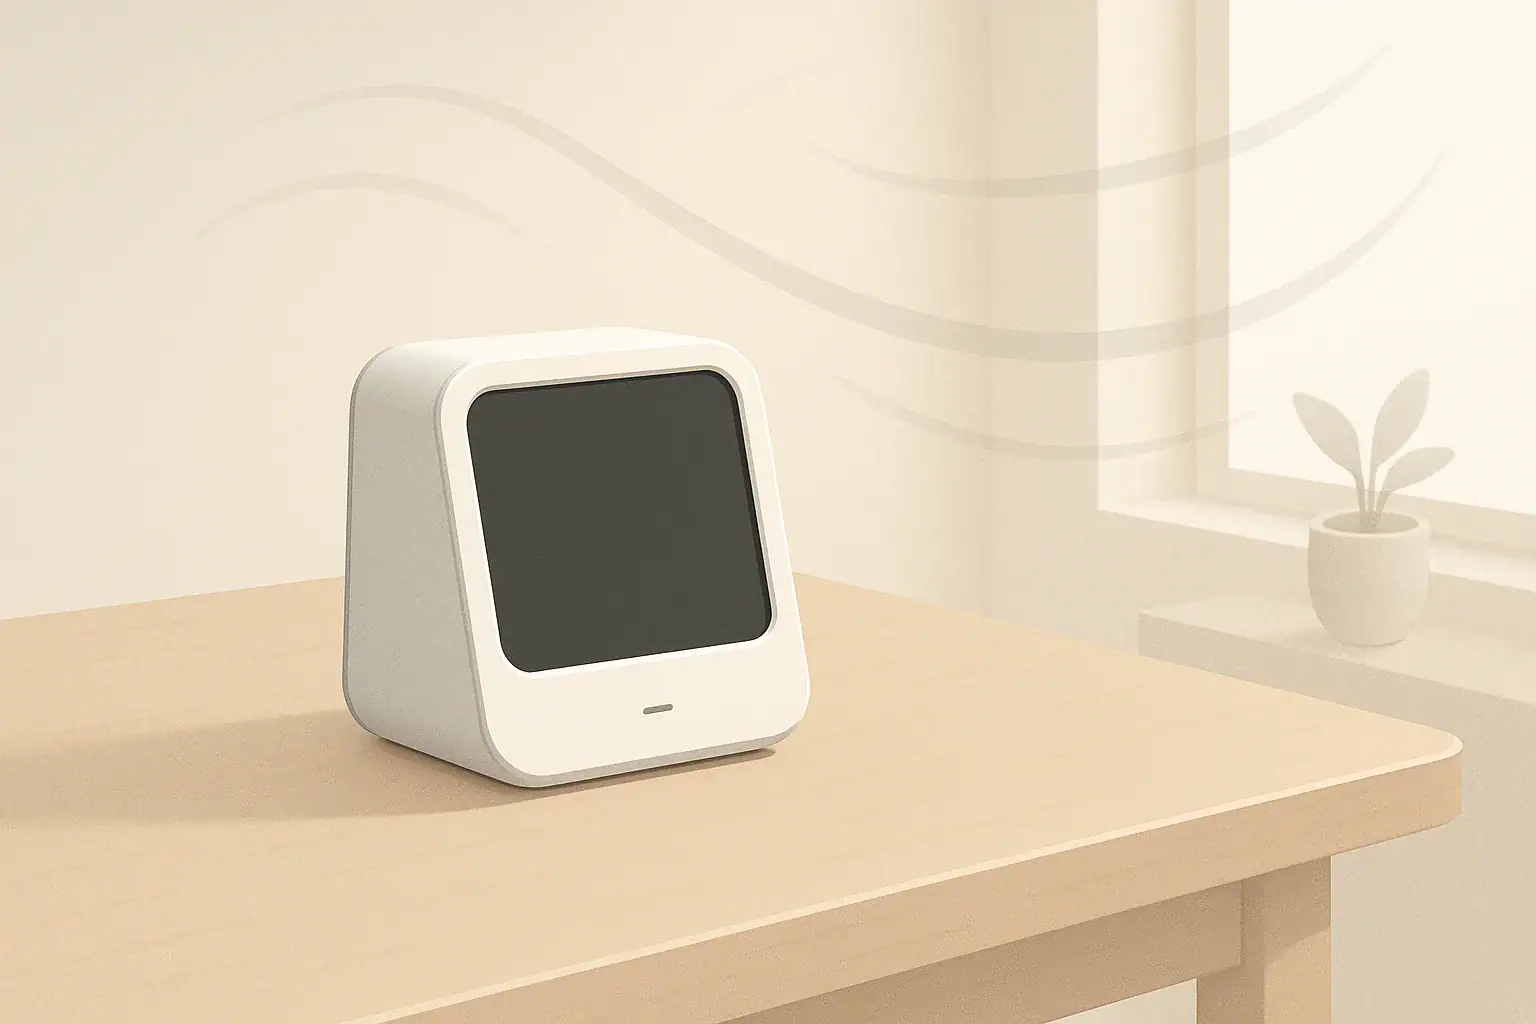
Isometric indoor air quality monitor on a minimalist desk

VOC monitors are limited because a single “TVOC” number lumps many different chemicals together, can be influenced by harmless sources, and often does not map clearly to health or comfort effects.

At home, VOC monitors can still be useful for spotting big changes in indoor air quality, but their readings are easy to misinterpret if you treat TVOC as a precise risk score. Understanding what the sensor actually measures, what it ignores, and how common activities skew the results helps you use the data calmly and practically.

Quick answer
  • TVOC is a rough “total gas” indicator, not a list of specific chemicals.
  • Short spikes from cooking, cleaning, or candles are common and usually drop with ventilation.
  • Pay more attention to long-lasting elevations over several hours than to brief peaks.
  • Use VOC data together with simple actions: source control, ventilation, and sometimes carbon filtration.
  • Avoid panic: there are no universal “one-size” TVOC limits for homes.

What VOCs and TVOC Actually Mean

Volatile organic compounds (VOCs) are a broad group of carbon-based chemicals that evaporate easily into the air. Indoors, they can come from building materials, furniture, paints, cleaning products, air fresheners, cooking, hobbies, and even people and pets.

Most home air quality monitors collapse all of this into a single value called total volatile organic compounds, or TVOC. This number might be shown in parts per billion (ppb), milligrams per cubic meter (mg/m³), or as an abstract “index.”

Why a single TVOC number is so limited

A TVOC reading is limited because it:

  • Does not tell you which VOCs are present.
  • Does not reveal whether levels are driven by a few strong sources or many weak ones.
  • Often responds to some gases more than others, depending on the sensor design.
  • Cannot, by itself, tell you what is safe or unsafe for a specific person.

As a result, the same TVOC value could represent very different indoor air situations. One room might be dominated by mild fragrance compounds; another might have smaller amounts of more concerning solvents. The TVOC would not explain that difference.

How Common Home VOC Sensors Work

Most consumer VOC monitors use one of two main sensor types: metal-oxide semiconductor (MOS) sensors or photoionization detectors (PIDs). Both have strengths and weaknesses that shape what you see as TVOC.

Metal-oxide VOC sensors

Metal-oxide sensors change their electrical resistance when exposed to certain gases. They are widespread in home monitors because they are compact and relatively low cost. However, they:

  • Respond to a wide range of gases, not just VOCs (for example, humidity and some non-VOC gases can influence readings).
  • May be calibrated to one “reference gas” in the lab, then estimate other VOCs as equivalents.
  • Can drift over time and need compensation by the device’s software.

Photoionization detectors

Photoionization detectors use ultraviolet light to ionize certain VOCs and measure the resulting current. They are more selective to VOCs than many MOS sensors and are common in professional instruments. Still, in a home environment they:

  • Do not detect all VOCs equally well (some require more energy to ionize).
  • Are influenced by humidity and other environmental conditions.
  • Often need regular calibration to stay accurate.

Whichever sensor type is used, the home display usually converts the raw signal into a single TVOC line. This line can show trends and relative changes, but its absolute accuracy and chemical detail are limited.

Table 1. Common home VOC sensor types and their typical behavior. Example values for illustration.
Sensor type What it responds to Typical strengths Common limitations
Metal-oxide (MOS) Broad mix of VOCs and some other gases Compact, affordable, shows relative trends Affected by humidity, drift, non-specific response
Photoionization (PID) Many VOCs above a certain ionization energy More sensitive, widely used in professional gear Needs calibration, not equal response to all VOCs
Electrochemical (for select gases) Specific gases such as formaldehyde or CO More targeted measurement Usually not “TVOC”; limited to chosen gas
Hybrid monitors Combination of VOC and other sensors Context from multiple metrics Software processing may hide raw behavior

Example values for illustration.

Why TVOC Numbers Can Mislead at Home

When you see a single TVOC number, it is tempting to treat it as a simple “good vs bad” score. In practice, there are several reasons this can be misleading.

1. Different VOCs, same TVOC

TVOC combines many chemicals into one figure. For example:

  • A scented candle may release primarily fragrance compounds.
  • Fresh paint can emit a wide mix of solvents.
  • Cooking produces a blend of VOCs and particles.

All three might drive TVOC to a similar range, but the underlying sources and practical responses differ. Without extra context, you cannot tell which situation you are dealing with.

2. Humidity and temperature influence readings

Many MOS VOC sensors are affected by humidity and temperature. When the weather changes, or when you shower or cook, the sensor may respond partly to these shifts as well as to actual VOC changes. Some devices try to correct for this in software, but the compensation is not perfect.

3. Short spikes are normal, but look “alarming”

Everyday activities can cause sharp, temporary TVOC spikes:

  • Using cleaning sprays or disinfectant wipes.
  • Applying nail polish or hair spray.
  • Cooking with high heat or frying.
  • Burning candles or incense.

When plotted on a graph, these spikes can look dramatic, even though they often drop back down with ventilation. Without time context, a snapshot reading taken during one of these peaks can be worrying, even if average exposure is much lower.

4. Sensor drift over months and years

VOC sensors can gradually drift, meaning the same real-world air may show different values as the sensor ages. Some home devices use algorithms that “re-baseline” readings to adapt to long-term conditions, but this can also mask slow changes from new furniture or renovations.

5. No universal “safe” TVOC threshold for homes

It might seem intuitive that there should be one precise TVOC limit for all homes. In reality:

  • Different organizations define and use TVOC differently in research and building guidelines.
  • Individual sensitivity to odors and VOCs varies widely from person to person.
  • Mixtures of VOCs can matter as much as total quantity.

Because of this, treating a single TVOC number as an absolute safety boundary is not appropriate. It is more useful as a trend indicator and a cue for ventilation or source control.

Using VOC Monitors Without Overreacting

Despite their limitations, VOC monitors can still help you understand how your home behaves if you use them thoughtfully. The key is to treat TVOC as one piece of information, not the full story.

Focus on patterns, not single readings

Instead of reacting to an isolated number, look for:

  • Daily patterns: Do readings rise reliably when you cook or clean, then fall afterward?
  • Baseline levels: Where does TVOC settle during quiet periods with no strong sources active?
  • Slow changes: Does your baseline creep up after bringing in new furniture or doing renovation work?

This pattern-based view is more reliable than any single snapshot.

Combine VOC data with other simple checks

To get more meaningful insights, combine TVOC readings with:

  • Odor and comfort: Do you notice persistent smells or stuffiness in a room?
  • CO₂ readings (if available): High CO₂ can suggest limited fresh air exchange.
  • Visual cues: Are there many fragranced products, solvents, or hobby materials in a small space?
  • Ventilation habits: Are windows usually closed; is there mechanical ventilation?

This broader context can guide practical steps, such as airing out a room or storing strong chemicals elsewhere.

Use changes to test simple actions

VOC monitors are particularly useful for cause-and-effect experiments. For example, you can:

  • Open windows for 10–20 minutes and watch how quickly readings fall.
  • Run a kitchen range hood while cooking and compare TVOC levels.
  • Move scented products out of a bedroom and see if the baseline changes.
  • Turn on an air cleaner with an activated carbon filter and observe trends over several hours.

These experiments help you learn which actions have the biggest impact in your specific home.

Practical Home Scenarios: TVOC in Context

Putting VOC monitor behavior into real-life scenarios helps show what is useful and what is noise.

Scenario 1: Evening cooking in an open-plan space

You start dinner and see TVOC climb rapidly during frying or grilling. The reading might jump several times above your quiet-time baseline. If you:

  • Use your range hood or open a window, and
  • See TVOC fall back toward baseline within 30–60 minutes after cooking,

this pattern is typical. The monitor confirms that cooking is a major VOC source and that ventilation is working.

Scenario 2: New furniture in a bedroom

After bringing in new pressed-wood furniture or a mattress, your overnight TVOC baseline in the bedroom might be higher than before, even with no obvious peaks. In this case, useful steps can include:

  • Increasing ventilation for the first days or weeks.
  • Leaving drawers or doors open temporarily to off-gas into a better-ventilated space.
  • Using an air cleaner with a suitable gas-adsorbing filter if ventilation is limited.

The monitor can help you see when the baseline gradually declines over time.

Scenario 3: Hobby room with solvents or adhesives

In a small room used for painting, model building, or crafts with glues and solvents, TVOC may stay elevated for longer, especially if windows remain closed. In this situation, a VOC monitor can be a reminder to:

  • Open windows or use local exhaust when you work.
  • Seal containers and store chemicals safely when not in use.
  • Allow time for air to clear before using the room for other purposes.

Here, the qualitative pattern (sustained elevation with slow decay) is more important than the exact value.

What VOC Monitors Do Not Tell You

Understanding what VOC monitors cannot provide is as important as knowing what they can.

No full chemical fingerprint

Consumer TVOC monitors do not perform detailed chemical analysis. They cannot specify which VOCs are present or their individual concentrations. For that level of detail, specialized laboratory methods such as gas chromatography are used.

No direct health diagnosis

TVOC values are not medical tools. They do not diagnose conditions, predict individual reactions, or replace professional evaluation. People vary widely in their sensitivity to odors and VOCs, so the same environment can feel different to different occupants.

Limited insight into particles and other pollutants

VOCs are only one part of indoor air. Many home monitors include separate sensors for fine particles (such as PM2.5) and sometimes for CO₂ or humidity. These metrics address different aspects of indoor air:

  • PM2.5: Fine particles from smoke, dust, and cooking aerosols.
  • CO₂: A proxy for how much exhaled air is building up indoors.
  • Humidity: Comfort, condensation, and mold risk considerations.

A VOC reading alone cannot capture these other factors, so it should be considered alongside them when possible.

Home Actions That Usually Matter More Than Exact TVOC Values

While a TVOC graph can be informative, the most practical improvements usually come from straightforward steps that do not depend on precise numbers.

Source control and product choices

Reducing VOC sources often has the largest impact. Options include:

  • Choosing low-odor or low-emission paints and finishes when available.
  • Limiting use of strong air fresheners or scented products in small rooms.
  • Storing solvents, fuels, and hobby chemicals in well-ventilated or detached spaces where feasible.
  • Allowing new furnishings to off-gas in a more open area before moving them into bedrooms.

Ventilation and air exchange

Bringing in outdoor air helps dilute VOCs. Practical steps:

  • Open windows for short, regular periods when outdoor conditions allow.
  • Use kitchen and bathroom exhaust fans during and after cooking or showering.
  • Check that existing mechanical ventilation (if present) is operating as intended.

Monitoring TVOC can help verify that these steps noticeably lower indoor levels after you apply them.

Filtration with appropriate media

Standard particle filters (such as HEPA) focus on solids and droplets, not gases. For VOCs and odors, gas-adsorbing media such as activated carbon are typically used. In practice:

  • Gas filters have limited capacity and eventually become saturated.
  • Effectiveness depends on filter size, airflow, and how much VOC is present.
  • They complement, but do not replace, ventilation and source reduction.

Your VOC monitor can offer some feedback on how strongly a gas-adsorbing filter is affecting TVOC, especially in closed rooms, but the relationship is not perfectly linear.

Simple VOC Monitor Checklist for Everyday Use

To use a VOC monitor calmly and effectively at home, you can follow a basic checklist:

  • Placement: Put the monitor in a representative breathing zone, away from direct vents or windows.
  • Baseline logging: Note typical values during quiet times (for example, overnight or when you are away).
  • Source mapping: Observe which activities or products cause marked increases.
  • Ventilation testing: Experiment with open windows, exhaust fans, or air cleaners and watch how quickly readings drop.
  • Slow trends: Look for gradual baseline changes after renovations, new furniture, or seasonal shifts.
  • Calibration and aging: If the device offers any form of recalibration or reset, follow the manufacturer’s instructions at suggested intervals.

This approach turns the VOC monitor into a learning tool rather than a source of anxiety over specific numbers.

Table 2. Common indoor monitor metrics and how to use them together. Example values for illustration.
Metric What it mainly reflects Common pitfalls Practical action idea
TVOC Broad mix of gases from products and activities Over-focusing on single values; confusing short spikes with long-term trends Use for pattern spotting and testing ventilation or source changes
PM2.5 Fine particles from smoke, dust, and cooking Ignoring short but intense spikes from cooking or candles Use exhaust hoods; consider particle filtration in busy areas
CO₂ Build-up of exhaled air indoors Treating it as a pollutant rather than a ventilation indicator Open windows or increase air exchange when CO₂ stays elevated
Temperature Thermal comfort Assuming it explains all comfort issues Adjust heating/cooling and check airflow patterns
Relative humidity Moisture level in the air Forgetting that extreme low or high humidity can be uncomfortable Aim to keep indoor humidity in a moderate range when possible

Example values for illustration.


Related guides: How to Choose the Right Air Purifier for Your Room SizeHEPA vs Activated Carbon: Best Setup for Allergies, Odors, and SmokeHow to Clean and Calibrate an Air Quality Monitor

Key Takeaways: Reading TVOC Without Guessing

VOC monitors and TVOC readings offer a window into how gases from everyday activities behave in your home, but they are not precise risk meters. A single TVOC number cannot capture which compounds are present, how sensitive a particular person might be, or how your air compares to every possible guideline.

Used thoughtfully, these monitors are most helpful as trend tools: they show when cooking, cleaning, new materials, or hobby products are changing your indoor air; they let you see how effective ventilation and filtration are in your own rooms; and they highlight slow shifts in your baseline over weeks or months. By focusing on patterns, combining TVOC with other metrics like particles and humidity, and prioritizing simple steps such as source control and fresh air, you can make practical indoor air decisions without being misled by a single, changing number on the screen.

Frequently asked questions

Can a TVOC reading identify which specific VOCs are present?

No. TVOC is an aggregate index that combines signals from many different gases and cannot specify individual chemicals or their concentrations; lab-based methods are required for chemical identification. Sensor type and calibration influence which compounds contribute most to the TVOC value, so the same number can reflect different mixtures.

How should I interpret short TVOC spikes during cooking or cleaning?

Short spikes are common and usually result from activities that release a burst of VOCs or change humidity and temperature. They often decline within minutes to hours with ventilation, so focus on pattern and decay rather than a single peak reading.

Do humidity and temperature make TVOC sensors give misleading readings?

Yes. Many common sensors, especially metal-oxide types, are influenced by humidity and temperature changes, and even photoionization detectors can be affected. Devices sometimes apply software compensation, but it is not perfect, so expect readings to vary with environmental shifts.

How often should a home VOC sensor be recalibrated or replaced?

Sensors can drift over months to years, so follow the device manufacturer’s recommendations for recalibration or maintenance; some units provide self-calibration or rebaseline features. If you notice unexplained long-term baseline shifts or inconsistent responses, consider recalibration or replacement.

Can an activated carbon air cleaner reliably lower TVOC readings?

Activated carbon and other adsorbents can reduce many VOCs and lower TVOC in closed rooms, but effectiveness depends on filter size, airflow, contact time, and the specific compounds present. Filters have limited capacity and become saturated, so combine filtration with source reduction and ventilation for best results.

How to Interpret Indoor AQI and PM2.5 Numbers

isometric indoor air quality monitor on a modern desk

To interpret indoor AQI and PM2.5 numbers, compare them to general comfort-oriented ranges, watch how they change over time, and adjust ventilation and filtration to nudge them lower when practical.

Indoor air quality monitors turn invisible particles into numbers, but those numbers only become useful when you know what they roughly mean for a typical home, what is realistic to aim for, and which simple steps move them in the right direction. This article explains indoor AQI and PM2.5 in plain language, using calm, practical ranges you can use to guide everyday decisions without guessing.

Quick answer
  • For many homes, a practical indoor PM2.5 target is often in the single digits to low teens (µg/m³) during normal days.
  • Try to keep indoor AQI noticeably lower than outdoor AQI, especially during smoke or pollution events.
  • Short spikes (cooking, cleaning) are common; focus more on the daily average than on a few minutes of high readings.
  • If numbers rise and stay elevated for hours, consider more filtration, better ventilation, or changing specific habits.
  • Use the same monitor in the same location when comparing readings over time; different devices can disagree.

What Indoor AQI and PM2.5 Actually Mean

Indoor AQI and PM2.5 numbers are ways to describe how many tiny particles are floating in your indoor air. They do not diagnose health problems, but they help you understand how clean or particle-heavy the air is in a simple, numeric way.

PM2.5 in plain language

PM2.5 stands for “particulate matter 2.5 micrometers and smaller.” These are fine particles from sources such as:

  • Cooking (especially frying, searing, toasting)
  • Candles, incense, and fireplaces
  • Tobacco or other smoke
  • Outdoor pollution or wildfire smoke leaking indoors
  • Dust resuspended by cleaning or movement

Monitors typically measure PM2.5 in micrograms per cubic meter (µg/m³). Lower values generally indicate less fine particle mass in the air.

What AQI represents

AQI (Air Quality Index) is a normalized scale that converts pollutant concentrations, often including PM2.5, into a single number. In the U.S., many monitors use a scale similar to the familiar outdoor AQI categories (green, yellow, orange, and so on), but implementation can vary by device and app.

When used indoors, AQI is essentially a translated version of your PM2.5 (and sometimes other pollutants) that attempts to match the style of outdoor reports. The practical use at home is comparison:

  • Compare indoor AQI to your own typical indoor baseline.
  • Compare indoor AQI to current outdoor AQI from a reliable source.
  • Watch trends over the day and between rooms.

Numbers as guides, not alarms

Home monitors are approximate tools. They help you see patterns and improve comfort, but they are not lab instruments and should not substitute for professional testing or medical advice. Use them to guide ventilation, filtration, and daily choices rather than as emergency alarms, unless a device is explicitly designed for that purpose.

Key Ranges and How to Read Your Monitor

There is no single “perfect” indoor PM2.5 number for every situation, but some general ranges are helpful for everyday decision-making in U.S. homes. These are practical comfort-oriented ballparks, not strict limits.

Everyday PM2.5 ballpark ranges (illustrative)

Many people aim for these approximate ranges indoors when feasible:

  • Roughly 0–5 µg/m³: Very low fine particle mass for a typical home; may be seen in well-filtered rooms or on clean outdoor air days.
  • Roughly 6–15 µg/m³: Common in homes with reasonable ventilation and some filtration; often a practical target band for day-to-day living.
  • Roughly 16–35 µg/m³: May occur during cooking, busy activity, or when outdoor air is moderately polluted; sustained readings here suggest you may benefit from changes.
  • Above ~35 µg/m³ for hours: Often corresponds to noticeably hazy conditions, heavy indoor sources, or bad outdoor smoke intruding inside.

For indoor AQI, many monitors roughly map these same patterns to color bands inspired by outdoor AQI. The exact breakpoints can differ by device, so check how your specific monitor defines its categories.

Short spikes versus long plateaus

It is useful to separate short events from long-lasting conditions:

  • Short spikes (minutes to an hour): Common with cooking, vacuuming, or lighting candles. These can easily jump above your normal range but then fall with ventilation and filtration.
  • Plateaus (several hours or more): Indicate a persistent source (for example, constant smoking, ongoing outdoor smoke, or poor ventilation) or insufficient filtration for the space.

Focus more on the typical daily level and multi-hour averages than on brief, predictable spikes.

Comparing rooms and baselines

To interpret numbers confidently, build your own baselines:

  • Measure the same room at the same time of day for several days.
  • Note how readings change when windows are open, air purifiers are on different speeds, or activities change.
  • Compare quieter rooms (bedrooms) with high-activity areas (kitchen, living room).

This pattern-based view helps you distinguish one-off events from ongoing issues.

Table 1. Example ways to respond to indoor PM2.5 readings – Example values for illustration.
Illustrative decision matrix for indoor PM2.5 ranges and simple responses
PM2.5 range (µg/m³) Typical situation (example) Example response idea
0–5 Well-filtered room; windows closed on a clean-air day Maintain current habits; use as a personal baseline.
6–15 Normal day with some cooking or activity Generally acceptable for many homes; fine-tune purifier speed or ventilation if desired.
16–30 Heavy cooking, candles, or outdoor pollution creeping in Increase purifier speed, use range hood, and ventilate when outdoor air is reasonable.
31–50 Prolonged cooking, frequent candles, or modest wildfire smoke outside Limit nonessential particle sources; seal windows more carefully during smoke events.
51–100 Noticeable indoor haze; nearby wildfire smoke or strong indoor sources Run purifiers on higher settings; close leaks to outdoors; minimize combustion indoors.
Above 100 Heavy indoor or outdoor smoke-like conditions Focus on creating at least one cleaner room with strong filtration and minimized sources.

Example values for illustration.

Common Misreadings and Monitor Limitations

Home air quality monitors can be extremely helpful, but they are not perfect. Misunderstanding their limitations is one of the most common reasons people feel confused or alarmed by their readings.

Differences between devices

Two different monitors sitting side by side often show different PM2.5 numbers. Reasons include:

  • Different internal sensors and calibration methods
  • Different algorithms for converting raw sensor counts to µg/m³
  • Different AQI formulas or breakpoints

Instead of comparing brands, compare each device to itself over time. Look at changes, patterns, and relative differences between rooms rather than exact agreement between devices.

Dust, humidity, and reading spikes

Optical particle sensors estimate particles by shining light through air and measuring scattering. This can be thrown off by:

  • High humidity: Tiny droplets can look like particles and cause readings to rise.
  • Large dust or fibers: May be counted in ways that do not perfectly match PM2.5 mass.
  • Near-source placement: A monitor placed right next to a kitchen stove or a candle can show very high local numbers that do not reflect the whole room.

If you see sudden, unexplained spikes, consider humidity, placement, and recent activities before assuming a serious problem.

Lag and mixing in the room

Air in a room does not mix instantly. You may see:

  • High numbers near a source (stove, smoking area) before the rest of the room is affected.
  • Delayed declines in PM2.5 after turning on a purifier, especially in larger rooms or complex layouts.

Allow some minutes for changes in ventilation or filtration to show up on the monitor, and consider air flow paths between the monitor, purifier, and sources.

Practical Steps When Indoor Numbers Rise

Once you understand what your AQI and PM2.5 numbers mean, the next step is deciding what to do in everyday situations. The goal is not perfection, but practical improvement with reasonable effort.

Step 1: Identify recent sources

When you notice a rise, first ask what changed in the past 30–60 minutes:

  • Cooking or baking
  • Toasting bread or frying food
  • Burning candles or incense
  • Vacuuming or dusting
  • Opening windows on a smoky or high-pollution day

If the monitor responds directly to known activities, that is a sign it is working as intended.

Step 2: Adjust ventilation and filtration

Your main tools for reducing particles are ventilation and filtration:

  • Ventilation: Open windows or use exhaust fans when outdoor air is reasonably clean. This can quickly dilute indoor particles.
  • Filtration: Run air purifiers or central systems with good filters at higher speeds when numbers are elevated, especially if outdoor air is worse than indoors.

During events like wildfires, ventilation and filtration may conflict. In those cases, many people prioritize keeping windows closed and relying more on filtration while outdoor AQI is very poor.

Step 3: Create at least one cleaner room

If whole-home improvement is difficult, focus on priority spaces such as bedrooms:

  • Place an appropriately sized purifier in the room.
  • Keep doors and windows more closed during high outdoor pollution.
  • Minimize particle sources in that space (no candles, smoking, or strong combustion sources).

This gives you a reference space to compare with higher-activity areas and can simplify decisions during regional smoke or pollution events.

Step 4: Adjust habits for frequent spikes

If your monitor shows frequent high spikes, consider small habit changes:

  • Use range hoods or exhaust fans consistently when cooking.
  • Prefer cooking methods that generate fewer particles when possible (for example, covered simmering instead of frequent high-heat frying).
  • Reduce or relocate frequent burning of candles or incense.
  • Vacuum with effective filtration and consider airing out afterward if outdoor air allows.

Small changes in how you use your home can have a noticeable effect on daily average PM2.5.

Real-World Indoor AQI and PM2.5 Scenarios

Seeing how numbers behave in common situations can make your own readings easier to interpret. The following examples are illustrative, not strict expectations.

Scenario 1: Evening cooking in a small apartment

In a compact kitchen-living area, you might see:

  • Baseline PM2.5 of around the single digits to low teens before cooking.
  • A quick rise into the 20–40 µg/m³ range during frying or broiling.
  • Gradual decline over 30–90 minutes with the range hood on and a purifier running.

If the numbers stay high for hours, it may indicate weak ventilation or a purifier that is undersized for the space.

Scenario 2: Wildfire smoke affecting a suburban home

On a smoky day with high outdoor AQI, a home might experience:

  • Outdoor PM2.5 rising far above usual values.
  • Indoor numbers climbing as doors open and small leaks allow smoke in.
  • Improved indoor readings when windows remain closed, gaps are reduced where reasonable, and air purifiers run at higher speeds.

A practical goal is to keep indoor AQI and PM2.5 significantly lower than outdoors, even if you cannot keep them as low as on a normal day.

Scenario 3: Bedroom with continuous filtration

In a bedroom with a well-sized purifier running continuously on a moderate speed, you might see:

  • Fairly stable PM2.5 in the low single digits to low teens most of the time.
  • Occasional brief rises when doors open or laundry is shaken out, followed by quick declines.
  • Small day-to-day variations based on outdoor air and whole-home activities.

This room then serves as a practical reference for how low your home can go under your current setup.

Safety, Standards, and What Home Monitors Can’t Do

Indoor AQI and PM2.5 readings are only part of the bigger indoor air picture. It helps to understand what they do not cover and how they relate to broader safety ideas.

Beyond particles: gases and other pollutants

PM2.5 numbers focus on fine particles but do not directly measure:

  • Carbon monoxide (CO)
  • Carbon dioxide (CO₂)
  • Volatile organic compounds (VOCs)
  • Excess humidity and mold risk

Some home monitors include additional sensors, but results are still approximate. Safety for combustion appliances and building systems should rely on dedicated safety equipment (for example, smoke alarms, CO detectors) and professional inspections where appropriate.

Ozone and active air cleaning technologies

Some devices use ionizers, plasma, or UV-based systems. Key points to keep in mind:

  • Ozone is a respiratory irritant; intentional ozone generators should not be used in occupied spaces.
  • Ionizing or reactive technologies may change how particles register on PM2.5 sensors, potentially lowering readings without simply capturing particles in a filter.
  • For many homes, mechanical filtration with appropriate filters and good room air mixing is a straightforward way to reduce PM2.5.

When evaluating devices, look beyond only the on-screen AQI or PM2.5 number and consider the underlying mechanism and whether it is appropriate for occupied rooms.

Monitors are not medical tools

Home AQI and PM2.5 monitors are not designed to diagnose or treat any health condition. They can help you:

  • Identify particle-generating activities.
  • Evaluate whether interventions (like filtration or ventilation changes) are working.
  • Make practical comfort-oriented adjustments.

Any specific health concerns should be discussed with a qualified professional, using the monitor only as background information if at all.

Maintenance, Filters, and Long-Term Tracking

To keep indoor AQI and PM2.5 numbers useful over months and years, both your monitor and your filtration systems need basic care.

Keeping your monitor reliable

Most consumer monitors require only simple upkeep:

  • Dusting: Keep vents and openings free of dust with a soft cloth or gentle air.
  • Stable placement: Avoid placing monitors directly in the path of purifier outlets or right next to obvious sources.
  • Consistent location: If you want meaningful trends, place the monitor in the same spot over time or record where each reading is taken.

Some higher-end devices may support recalibration or firmware updates; follow the manufacturer’s instructions if available.

Filter upkeep and its impact on numbers

Filters eventually clog, which can reduce air flow and change how quickly PM2.5 falls in a room. General considerations:

  • Follow suggested replacement intervals as a starting point, adjusting for your actual usage and conditions.
  • Watch for slower recovery after particle spikes as one informal sign that filtration may be less effective.
  • Consider that very clogged filters can reduce clean air delivery even if the purifier still runs.

Using your monitor to track how fast PM2.5 decreases after a known event (like cooking) can help you see whether filtration performance is changing over time.

Long-term trend tracking

Over months, you can use your monitor as a simple logbook:

  • Note average PM2.5 levels by season (winter, summer, wildfire season).
  • Record the approximate range before and after major changes (new purifier, upgraded filters, more frequent range hood use).
  • Observe how building changes (new windows, added insulation, ventilation tweaks) influence indoor baseline values.

This long view helps you separate temporary weather or event-driven fluctuations from structural improvements.

FAQ: Everyday Questions About Indoor AQI and PM2.5

Is 0 µg/m³ realistic indoors?

Some monitors occasionally show 0 µg/m³, especially in cleaner rooms or due to sensor resolution. In practice, air always contains some particles. Treat 0 on a consumer monitor as “very low for this device” rather than true zero.

Should I worry about brief peaks during cooking?

Short-term increases during cooking are normal. It is generally more productive to:

  • Use exhaust fans and lids while cooking.
  • Run a purifier nearby during and after cooking.
  • Focus on how quickly levels return toward your normal baseline.

Is a higher fan speed always better?

Higher speeds usually clean air faster but may be louder and use more energy. Many people run purifiers on lower, quieter settings most of the time and increase speed during known particle-generating activities or outdoor smoke events.

Do I need a monitor in every room?

Not necessarily. A single monitor in a representative location can still be useful. Additional monitors can help if you want to:

  • Compare bedrooms with living spaces.
  • Track a nursery or workspace separately.
  • See how well air moves through a larger or more complex floor plan.

Related guides: PM2.5 Explained: What the Numbers Mean and What’s a Safe Level IndoorsWildfire Smoke Indoors: Step-by-Step Plan to Lower PM2.5 FastAir Purifier Placement: Where to Put It for Best Results

Frequently asked questions

How long should I run an air purifier after cooking to return PM2.5 to baseline?

It often takes about 30–90 minutes for PM2.5 to fall near baseline after cooking, depending on room size, purifier capacity, and ventilation. Use your monitor to watch the decline and increase purifier speed or use exhaust ventilation when outdoor air is clean to speed recovery.

Can high indoor humidity cause misleading PM2.5 spikes?

Yes. Optical sensors can count tiny water droplets as particles, so high humidity or nearby steam can cause short-lived elevated readings. Check humidity alongside PM2.5 and move the monitor away from steam sources or reduce humidity to verify true particle levels.

How should I compare indoor AQI to outdoor AQI during wildfire smoke?

A practical approach is to aim for indoor AQI that is noticeably lower than outdoor AQI by keeping windows closed, sealing obvious gaps, and running filtration. When outdoor AQI is very poor, prioritize filtration over opening windows and focus on trends rather than expecting identical absolute values.

Do I need a monitor in every room to understand my home’s air quality?

Not usually. One monitor in a representative spot provides useful trends, but additional monitors are helpful if you need to compare bedrooms, identify hotspots like kitchens, or assess air movement in larger or complex layouts. Keep placement consistent to make comparisons meaningful.

When should I seek professional testing instead of relying on a home monitor?

Consider professional testing if elevated PM2.5 persists despite reasonable interventions, if occupants have unexplained health symptoms, if you suspect combustion appliance leaks, or if you need formal documentation for remediation. For safety-critical hazards like carbon monoxide, use dedicated alarms and qualified inspectors.

Key Takeaways for Using Indoor AQI and PM2.5 Calmly

Interpreting indoor AQI and PM2.5 numbers becomes much easier when you treat them as guides to relative change rather than absolute verdicts. Build your own baseline in a few key rooms, notice which activities cause predictable spikes, and use ventilation and filtration to gently lower your everyday averages where practical.

Instead of chasing a single “perfect” number, aim for reasonable, stable PM2.5 levels, especially in rooms where you spend the most time. Over weeks and seasons, your monitor can then help you test small adjustments, understand outdoor events like wildfire smoke more clearly, and make more informed, low-stress decisions about your home air.

CO2 Monitor Buying Guide: NDIR vs eCO2 Explained

Isometric indoor CO2 monitor on a minimalist desk

The main thing to look for in a home CO2 monitor is a true NDIR CO2 sensor rather than an estimated “eCO2” value, plus stable readings, clear units, and simple calibration options.

Indoor CO2 monitoring helps you understand how well your home is ventilated and when it may be time to bring in more fresh air. Many small displays and smart-home devices show a CO2 or “air quality” number, but not all of them measure actual carbon dioxide. Knowing the difference between NDIR and eCO2, and a few key specs, makes it much easier to choose a useful, reliable monitor.

Quick answer
  • Prefer a monitor with a true NDIR CO2 sensor, not only an “eCO2” value.
  • For most homes, aim to keep indoor CO2 roughly within ~600–1200 ppm as a general ventilation-comfort range.
  • Look for readings in ppm, update rate around 1–5 minutes, and data averaging to avoid jumpy numbers.
  • Make sure there is a way to calibrate or auto-calibrate the sensor, following the manual.
  • Check that the display is readable from your typical viewing distance and shows units clearly.
  • Place the monitor away from open windows, direct breathing, and heat sources for more representative readings.

Why CO2 Monitoring Matters for Home Air Quality

Carbon dioxide (CO2) is a normal part of indoor air. People exhale CO2, and without enough fresh air, its concentration can build up indoors. Higher indoor CO2 levels are mainly a sign of low ventilation rather than a contaminant on their own at typical home levels.

A CO2 monitor is useful because it gives you a simple, continuous indicator of how much outside air is mixing into your space. When the monitor shows higher values, it often means:

  • Many people are in a room for a long time.
  • Windows and doors are mostly closed.
  • Mechanical ventilation is weak or off.

By watching how CO2 levels respond when you open a window, run a bathroom or kitchen fan, or adjust HVAC, you can learn how effectively your home clears out stale air. This is especially helpful in bedrooms, home offices, and gathering spaces where people spend long blocks of time.

NDIR vs eCO2: Key Concepts and How Sensors Work

When you shop for a CO2 monitor, the most important technical distinction is between real CO2 measurement (NDIR) and estimated or “equivalent” CO2 (eCO2). These two approaches behave very differently.

What is an NDIR CO2 Sensor?

NDIR stands for nondispersive infrared. An NDIR CO2 sensor shines infrared light through a small air sample and measures how much light is absorbed at wavelengths characteristic of CO2 molecules. From this absorption, the device calculates CO2 concentration, usually in parts per million (ppm).

Common characteristics of NDIR CO2 sensors include:

  • Direct measurement: They measure CO2 itself, not a proxy.
  • Units: Typically display ppm (for example, 420 ppm, 900 ppm).
  • Stability: Reasonably stable over time with proper calibration.
  • Cost and size: Historically larger and more expensive than simple gas or VOC sensors, but now common in consumer devices.

What is eCO2 or “Equivalent CO2”?

Many small air quality devices show a number labeled eCO2 or “CO2 equivalent.” These devices usually do not measure CO2 directly. Instead, they measure total VOCs (volatile organic compounds) with a different type of gas sensor and then estimate a “CO2-like” number using an internal algorithm.

Key points about eCO2:

  • Indirect estimate: The sensor is responding to VOCs, not CO2.
  • Sensitivity to odors: Cooking fumes, cleaning products, fragrances, and off-gassing can spike readings even if real CO2 is unchanged.
  • Less reliable for ventilation: Because it blends VOC behavior with assumed human activity, it can misrepresent actual CO2 concentration.
  • Useful as a general “air freshness” indicator: but not a substitute for real CO2 monitoring.

How to Tell if a Device is NDIR or eCO2

Product descriptions may not always be clear. In general, you can look for:

  • Mentions of “NDIR” or “nondispersive infrared” in the specs (indicates real CO2).
  • Use of the term “eCO2” or “CO2 equivalent” alongside “VOC sensor” (indicates estimated value).
  • Technical sheets or manuals that list both VOC and eCO2 readings from the same sensor module.

If your goal is to understand ventilation using CO2 as a tracer, a monitor with a true NDIR sensor is usually the better choice.

Table 1. NDIR CO2 vs eCO2 monitors at a glance – Example values for illustration.
Comparison of NDIR CO2 and eCO2-based devices
Aspect NDIR CO2 monitor eCO2 / VOC-based display
What it measures Actual CO2 molecules by infrared absorption VOCs with gas sensor, then estimates “equivalent” CO2
Best use Ventilation tracking, occupancy impact, trend logging General air freshness / odor changes
Typical units CO2 in ppm eCO2 in ppm plus TVOC in ppb/µg/m³
Response to cooking or cleaners Little change unless people are present Often large spikes from VOC emissions
Response to opening windows CO2 value generally drops as fresh air comes in May drop, but also affected by outdoor odors and VOCs
Calibration needs Periodic baseline or fresh-air calibration recommended Occasional reset or burn-in; less direct calibration
Interpretation simplicity More straightforward for CO2-focused use Requires caution: VOC-driven, not pure CO2

Example values for illustration.


Understanding CO2 Readings and Common Target Ranges

Most home CO2 monitors display results in parts per million (ppm). Outdoor background CO2 typically sits in the low hundreds of ppm. Indoors, values change throughout the day depending on occupancy and ventilation.

Typical Indoor CO2 Patterns

In a reasonably ventilated home, you might see patterns such as:

  • Unoccupied or freshly aired room: readings often near outdoor levels, sometimes a few hundred ppm above outside.
  • Lightly occupied living areas: values may rise into the mid-hundreds to around 1000 ppm during normal use.
  • Bedrooms overnight: with doors and windows closed, readings often climb, sometimes exceeding 1000 ppm or more, especially in small rooms.

These numbers are not strict limits. For typical households, many people use CO2 monitoring more as a ventilation feedback tool than as a strict rule. A common practical approach is to watch for sustained higher values and respond with more fresh air or ventilation when reasonable.

Using CO2 as a Ventilation Signal, Not a Diagnosis

CO2 readings tell you about ventilation efficiency and occupancy, not the full story of air quality or health. For example:

  • A room can have modest CO2 but still contain odors or VOCs from products or materials.
  • A room with higher CO2 may otherwise have low particulate matter if you use good filtration.

It is generally helpful to consider CO2 alongside other indicators like humidity, PM2.5, and TVOCs if your monitor supports them, but avoid treating any single number as a diagnosis or medical metric.

Common CO2 Monitor Mistakes and Troubleshooting

Even a good NDIR CO2 monitor can give confusing readings if it is used or interpreted incorrectly. Several common issues show up repeatedly in homes.

Poor Placement

Where you place the monitor strongly affects readings. Common placement mistakes include:

  • Too close to people’s faces: Exhaled breath contains very high CO2 and can spike readings when you talk or breathe toward the sensor.
  • Directly in sunlight or on hot surfaces: Temperature swings can affect sensors and cause drift.
  • Right next to windows, vents, or doors: You may track drafts instead of the room’s typical air.

A more representative location is often:

  • At breathing height when seated or standing.
  • Away from corners and direct airflow blasts.
  • Not on top of electronics or radiators that generate heat.

Misunderstanding Auto-Calibration

Many NDIR sensors use something called automatic baseline calibration (ABC). The sensor assumes that at some point over a period (for example, several days) it will see fresh-air levels, and it slowly adjusts its baseline to match.

Issues can arise when:

  • The device is used in a space that is never well ventilated, so it never “sees” near-outdoor levels.
  • It remains in a single, always-occupied room where CO2 is consistently elevated.

In those cases, the sensor may slowly “normalize” to higher values and under-report real CO2. To avoid this, some people periodically place the monitor in well-ventilated areas (or outside in a protected spot, if allowed by the manual) during calibration cycles, or they disable ABC if manual calibration is available and properly supported.

Confusing eCO2 with Real CO2

Another frequent issue is reading an eCO2 display as if it were real CO2. If your device bases its values on VOCs, you might notice large spikes when cooking, using cleaners, or spraying products, even when no extra people are present.

When that happens, the monitor is telling you that VOCs increased, not necessarily that people-based CO2 did. That is still useful information but should be interpreted as a general air contaminant/odor change rather than a pure ventilation indicator.

Practical Buying Checklist: What to Look For

When comparing CO2 monitors for home use, focusing on a few key features makes the selection process simpler. Use this as a non-brand-specific checklist.

1. Sensor Type and Specifications

  • Sensor type: Prefer explicit mention of NDIR CO2 measurement if your goal is ventilation tracking.
  • Stated measurement range: For homes, a range up to at least ~3000 ppm is typically sufficient; some go higher.
  • Resolution and accuracy: Look for ppm-level resolution; accuracy is often listed as a percentage of reading or absolute ppm. Treat these as approximate guides rather than guarantees.

2. Display and Readability

  • Clear units: It should be obvious when a number is CO2, eCO2, or another metric.
  • Legible at a distance: Larger digits and simple layouts are easier to check at a glance.
  • Minimal clutter: Too many simultaneous metrics can make it harder to focus on CO2 trends.

3. Data Logging and Connectivity

Not everyone needs logging or apps, but they can be helpful if you want to see patterns over days or weeks.

  • History trends: Some devices store hourly or minute-level data so you can review past nights or gatherings.
  • Export options: CSV or similar formats make it easier to graph data on a computer.
  • Smart-home integration: May allow automations, such as turning on a fan when CO2 crosses a threshold, if you already use those systems.

4. Power and Placement Flexibility

  • Power source: Options include USB power, wall adapters, or internal rechargeable batteries.
  • Battery vs plug-in: Battery-powered units offer flexible placement but need periodic charging; plug-in units can run continuously in a fixed spot.
  • Mounting: Some monitors are meant for desks or shelves; others can be wall-mounted to keep them out of the way.

5. Calibration and Maintenance

  • Calibration method: Check whether the device provides auto-calibration, manual calibration, or both.
  • Instructions: Clear guidance on how and when to calibrate helps ensure stable readings.
  • Expected lifespan: Many NDIR sensors slowly age over several years; manuals may give a general replacement or recalibration timeframe.

Real-World Home Scenarios: How a CO2 Monitor Helps

To make the specifications more concrete, it helps to picture how a CO2 monitor fits into everyday situations.

Bedroom Overnight

In a typical bedroom with one or two people sleeping and windows closed, CO2 often rises steadily overnight. A monitor placed away from the bed but at breathing height might show a slow upward curve. Watching this pattern over several nights can help you see whether small changes—like opening a window slightly, running a supply fan if available, or leaving the door ajar—keep CO2 more stable.

Home Office or Study Area

In a home office, especially in newer, tighter buildings, CO2 can climb during long work sessions with windows closed. A monitor on the desk (not directly in your exhaled breath) can remind you when it is a good time to open a window or step outside for a break, using rising values as a cue that air has become more “stale.”

Living Room Gatherings

When several people gather in a living room, CO2 can rise much faster. A visible display can encourage timely actions such as cracking a window, turning on a kitchen or bathroom exhaust fan, or adjusting any existing mechanical ventilation. Over time, you learn what typical values look like for your space at different occupancy levels.

Comparing Rooms in the Same Home

If you move a single NDIR monitor from room to room on different days, you can compare how each space behaves. For example, you might find that one bedroom consistently shows higher overnight CO2 than another, suggesting less air exchange. That can guide small changes in how you use windows, doors, or fans.

Safety, Standards, and What CO2 Monitors Do Not Do

Consumer CO2 monitors provide useful information about ventilation and occupancy, but it is important to understand their scope and limits.

Not a Combustion Safety Device

CO2 monitors are not a substitute for dedicated safety detectors for carbon monoxide (CO) or combustible gases. If your home uses fuel-burning appliances or has an attached garage, follow local codes and best practices for installing proper CO and smoke detectors, and maintain appliances according to manufacturer instructions.

No Direct Medical or Health Diagnosis

While CO2 is often discussed in relation to comfort and alertness, home monitors are not medical devices. They do not diagnose conditions or replace professional advice. Instead, think of them as environmental tools that help you understand and manage ventilation alongside other comfort factors like temperature and humidity.

CO2 vs Other Pollutants

CO2 levels do not automatically tell you about particles (such as dust or smoke) or VOCs (from materials, cleaners, or activities). If you want a broader picture of indoor air, some devices combine CO2 with PM2.5 and TVOC sensors, but each metric still represents a different aspect of air quality.

Maintaining and Using Your CO2 Monitor Over Time

Once you have a monitor, a few simple practices help keep readings consistent and useful.

Routine Care and Calibration

  • Dusting: Wipe the exterior gently with a dry or slightly damp cloth to keep vents clear.
  • Avoid liquids: Do not spray cleaners directly into vents or onto the sensor area.
  • Calibration intervals: Follow the manual’s recommendations. Some units suggest periodic exposure to fresh outdoor air; others rely entirely on automatic routines.

Like many environmental measurements, CO2 readings are most useful when you look at trends:

  • How fast does CO2 rise when people enter a room?
  • How quickly does it fall after you open a window or run a fan?
  • What are typical overnight peaks in different bedrooms?

Watching these patterns makes it easier to decide which ventilation strategies have a meaningful effect, without focusing on any single reading.

Integrating CO2 Monitoring with Other Comfort Steps

CO2 is one piece of overall indoor air comfort. You might combine CO2 monitoring with:

  • Using exhaust fans during and after cooking or showering.
  • Managing humidity with humidifiers or dehumidifiers to stay in a comfortable middle range.
  • Using air purifiers with particle filters to reduce PM2.5 from dust, smoke, or other sources.

Together, these tools help you create spaces that feel fresher and more pleasant day to day.

Table 2. Key home air monitor metrics – Example values for illustration.
Monitor metrics and how to interpret them
Metric What it mainly indicates Common pitfalls General action idea
CO2 (ppm) Ventilation level vs occupancy Reading influenced by poor placement and auto-calibration Increase outdoor air exchange when sustained levels rise
eCO2 (ppm) Estimated CO2 from VOC behavior Spikes from odors or products misread as occupancy changes Treat as general freshness signal, not exact CO2
TVOC Total volatile organic compounds Large variation between homes and activities Ventilate, reduce strong chemical sources where practical
PM2.5 Fine particles like dust or smoke Short spikes from cooking or cleaning Use filtration, exhaust, and source control as needed
Temperature Thermal comfort Sensor near heat sources gives misleading values Adjust HVAC or fans for preferred comfort range
Relative humidity Moisture level in air Drafts or nearby humidifiers skew readings Use humidifiers/dehumidifiers and ventilation to stay moderate

Example values for illustration.


Related guides: CO2 Monitors for Homes: What Good Numbers Look Like and Why They MatterAir Exchange Basics: ACH, Infiltration, and Why “Stuffy” HappensHow to Ventilate in Winter Without Freezing: Practical Strategies

Key Takeaways When Choosing a CO2 Monitor

For most households, a CO2 monitor is primarily a ventilation feedback tool. Choosing a unit with a true NDIR sensor, clear ppm display, and sensible calibration options helps you understand how your home actually exchanges air as you live in it.

Place the monitor thoughtfully, watch trends instead of single readings, and use changes in CO2 as a gentle nudge to bring in more fresh air when practical. Combined with attention to particles, humidity, and VOCs, CO2 monitoring can be a straightforward way to stay more in tune with your indoor environment over time.

Frequently asked questions

How can I confirm whether a monitor reports true CO2 (NDIR) or eCO2?

Check the product specifications or manual for the term “NDIR” or “nondispersive infrared” to indicate true CO2 measurement; mentions of eCO2, TVOC, or a VOC sensor usually mean an estimated CO2 value. If specs are unclear, controlled checks can help: an eCO2 device often spikes when cooking or using scented products, while an NDIR unit stays tied to occupancy-driven CO2 changes.

What indoor CO2 range should I aim for in typical home use?

For most homes, a practical target is roughly 600–1200 ppm as a comfort and ventilation guide; outdoor background CO2 is commonly in the low hundreds. Sustained levels above about 1000–1200 ppm often indicate you should increase fresh air or ventilation where practical.

How does automatic baseline calibration (ABC) affect NDIR sensor accuracy?

ABC assumes the sensor will periodically see near-outdoor air and slowly adjusts its baseline; this works well if the device is sometimes exposed to fresh air. In constantly occupied or poorly ventilated spaces ABC can cause the baseline to drift upward, so follow the manual for periodic manual calibration or occasional exposure to fresh air if recommended.

Can I use an eCO2 reading as a ventilation indicator?

eCO2 can be a useful general “air freshness” signal, but it is derived from VOC measurements and is sensitive to odors, cooking, and chemicals rather than just human breath. For reliable ventilation tracking and occupancy-based CO2 trends, a true NDIR CO2 monitor is preferable.

Where should I place a CO2 monitor to get representative readings?

Place the monitor at typical breathing height, away from windows, doors, direct vents, heat sources, and not directly in people’s exhaled breath. Avoid corners and locations on top of warm electronics to reduce misleading spikes or drift and get a better sense of the room’s overall ventilation.

PM2.5 Sensor Accuracy Explained: What Matters

isometric indoor air quality monitor on a modern desk

PM2.5 readings differ between devices because sensors use different measurement methods, calibrations, and sampling conditions, and they respond differently to particle types and room placement.

At home, PM2.5 monitors are useful for trends and comparisons over time, but they rarely match each other exactly. Understanding how these sensors work, what affects their accuracy, and how to interpret their numbers helps you focus on meaningful changes in your indoor air rather than chasing exact agreement between devices.

Quick answer
  • Expect low-cost PM2.5 monitors to differ from each other by 20–50% at any moment.
  • Look for stable trends: rising, falling, or flat over 15–30 minutes matters more than exact numbers.
  • Place monitors 3–5 ft above the floor, away from direct vents, windows, and stoves.
  • Use outdoor PM2.5 data as a loose reference, not a perfect calibration target.
  • Clean intakes and follow warm-up time (often 5–15 minutes) for more stable readings.

What PM2.5 sensor accuracy means and why it matters

PM2.5 refers to airborne particles with diameters roughly 2.5 micrometers and smaller. These include fine dust, smoke, and some components of outdoor pollution that can penetrate deep into the respiratory system. Home PM2.5 sensors estimate the concentration of these fine particles in the air, usually expressed as micrograms per cubic meter (µg/m³).

Accuracy for PM2.5 sensors has two main parts:

  • Absolute accuracy – how close the reading is to a well-calibrated reference instrument.
  • Consistency (precision) – how repeatable the readings are when conditions are the same.

Most consumer sensors are designed more for consistency than for laboratory-grade accuracy. They are usually good at detecting changes (for example, cooking versus not cooking) but may not match a reference device or other monitors exactly.

This matters for home use because your main questions are often practical: When should I turn on an air purifier, open a window, or avoid extra pollution indoors? For these decisions, relative changes and general ranges are more important than having the exact same number on every monitor.

How PM2.5 sensors work and the limits of low-cost technology

Most affordable home PM2.5 monitors use optical particle counters, sometimes called laser scattering sensors. Their basic working principle is similar across brands, but details differ in ways that affect accuracy.

Optical scattering in simple terms

  • A small fan or pump pulls air through a sensing chamber.
  • A light source (often a laser diode or LED) shines across the air stream.
  • Particles passing through scatter the light; a detector measures this scattered light.
  • Electronics estimate how many particles are present and their approximate size.
  • The device converts this information into an estimated mass concentration (µg/m³) of PM2.5 using built-in assumptions.

Laboratory-grade instruments can heat, dry, and carefully control the air they sample and use more complex optics and calibration. Home sensors are smaller, cheaper, and more exposed to room conditions, so they have more variability.

Why built-in assumptions matter

To turn scattered light into mass concentration, the sensor assumes certain things about the particles:

  • Shape and density (for example, spherical, with density similar to typical urban dust).
  • Refractive index – how the particle interacts with light.
  • Size distribution – what fraction of particles are fine, coarse, etc.

Real-world particles vary a lot. Cooking aerosols, wildfire smoke, pollen fragments, and road dust each scatter light differently. Two sensors with different internal assumptions can give different PM2.5 numbers from the same air even if both are working correctly.

Comparison of common PM2.5 sensing approaches – Example values for illustration.
Sensor type Typical use Relative accuracy Key limitations
Low-cost optical (consumer) Home monitors, smart devices Good for trends, rough ranges Sensitive to humidity, particle type, airflow
Higher-grade optical (regulatory support) Research, supplemental outdoor networks Better agreement with reference tools Requires maintenance and careful calibration
Gravimetric reference Standards, official comparisons Highest mass accuracy Slow, complex, not for real-time home use
Hybrid sensor packages Some advanced monitors Improved stability and drift control Still dependent on algorithms and assumptions

Example values for illustration.

Why two PM2.5 devices show different numbers

When two PM2.5 monitors sit side by side and do not match, several factors may be involved. Often, more than one of these is happening at the same time.

1. Different calibration and factory settings

Each sensor is calibrated at the factory with test particles and internal algorithms. Even if two devices use the same sensor model, their firmware or quality checks can differ, leading to slightly different baselines. A consistent offset (for example, one device always reading about 5–10 µg/m³ higher) is commonly due to calibration differences rather than a fault.

2. Sensor tolerances and aging (drift)

Electronic components and light sources have manufacturing tolerances and change over time. As a sensor ages, its response can drift, particularly if it is used in dusty or humid environments. Two devices that were closer when new can slowly separate in their readings after months or years of use.

3. Placement and micro-environments

Indoor air is not perfectly mixed. PM2.5 can vary over short distances, especially near sources or air movement:

  • Near a stove, candle, printer, or smoking area.
  • Close to an air purifier outlet or intake.
  • In a draft from a vent, window, or door.

Even a few feet of separation can cause real differences in particle concentration. If one sensor is closer to a source or in a corner with less mixing, its reading can be legitimately higher or lower.

4. Humidity and particle composition

High relative humidity can cause hygroscopic particles (those that absorb water) to swell, changing how they scatter light. Many low-cost optical sensors respond to this change as if the particle mass increased, so PM2.5 readings may spike in humid conditions or near humidifiers. Different sensor designs and algorithms can over- or under-react to these changes, so devices will disagree more when humidity is high.

5. Sampling rate and averaging time

Some monitors show near-real-time data updated every few seconds; others average over 1, 5, or 15 minutes. A sensor with heavy smoothing may show a lower peak during short pollution events but a higher value for longer episodes. When comparing two devices, consistent averaging windows are crucial; otherwise, one may appear “slower” or “less sensitive” than the other.

6. Fan speed and airflow design

The rate at which air moves through the sensor chamber affects how many particles are sampled. A blocked intake, slow fan, or different internal airflow design can change readings. Regular dust buildup near inlets or filters inside the device also affects performance over time.

Common mistakes when judging PM2.5 sensor accuracy

Many frustrations with PM2.5 sensors come from expecting them to behave like laboratory instruments. A few common pitfalls can make differences between devices seem larger than they really are.

Comparing while devices are still warming up

Some sensors need 5–15 minutes to stabilize after power-on. During this warm-up, internal temperatures and fan speeds can drift, causing unstable or biased readings. If you compare devices immediately after plugging them in, you may see misleading gaps.

Testing right next to a strong source

Holding two monitors directly over a pan, candle, or smoking source will expose them to rapid, uneven plumes of particles. Small timing differences in how each device samples the air result in big temporary differences. For comparison, it is better to place them side by side in a stable location away from immediate sources.

Ignoring humidity and temperature changes

Switching on a humidifier, showering with the door open, or opening windows on a humid day can all change how sensors respond. Assuming that all PM2.5 changes are due to pollution can lead to incorrect conclusions about sensor performance.

Expecting exact agreement with outdoor readings

Outdoor PM2.5 data from regulatory or community networks often use different sensor types, data corrections, and averaging periods. Indoor readings will also be affected by building leaks, filtration, and indoor sources. Matching indoor numbers exactly to outdoor values is not a realistic test of accuracy.

Practical ways to interpret PM2.5 readings at home

Instead of focusing on single numbers, it is more useful to look at patterns, ranges, and context. This approach aligns better with how consumer sensors are designed.

Focus on relative changes, not exact values

Ask questions like:

  • Does PM2.5 rise when I cook or burn candles?
  • How quickly does it fall after I run the air purifier or open windows?
  • Is the usual background level in this room higher than in others?

If two monitors show similar patterns (both go up and down at roughly the same times), they are likely working as intended even if their values differ by a few µg/m³.

Use broad ranges as guidance

Consumer devices often map PM2.5 values to simple categories (for example, low, moderate, high). While exact category boundaries vary, these broad ranges can still be helpful for home decisions:

  • Lower end of the range – indoor sources are minimal, filtration and ventilation are generally effective.
  • Middle range – typical for many homes with occasional indoor activities that generate particles.
  • Higher end of the range – indicates more intense sources (heavy cooking, smoke) or limited ventilation and filtration.

Treat the ranges as guides to adjust behavior or equipment use, not as strict pass/fail lines.

Cross-check with your environment

When readings change, look around:

  • Did someone start or stop cooking?
  • Was a door or window opened or closed?
  • Did you turn an air purifier, fan, or HVAC system on or off?
  • Did you use candles, incense, or other combustion sources?

When changes in PM2.5 match visible activities, it is a sign that the sensor is capturing real trends, even if it does not agree perfectly with another device.

Examples of PM2.5 reading differences in real-life scenarios

Concrete situations can make the reasons for differing readings easier to understand. Here are a few common home scenarios and what to expect.

Scenario 1: Cooking in an open-plan kitchen

Two monitors are placed in an open-plan living and kitchen area. One is on the kitchen counter; the other is on a shelf 15 feet away.

  • During frying or searing, the kitchen monitor spikes quickly and reaches a higher peak.
  • The living-area monitor shows a slower rise and a smaller peak.
  • After cooking stops and a range hood or window is used, both monitors decline but may not drop at exactly the same rate.

These differences largely reflect real spatial gradients in particles and airflow, not necessarily sensor inaccuracy.

Scenario 2: Wildfire smoke infiltration

Outdoor PM2.5 is elevated due to regional smoke. The home has one monitor near a leaky window and another in an interior bedroom.

  • The monitor near the window rises first as smoke seeps in.
  • The bedroom monitor rises later and may peak at a lower level, especially if doors are closed and an air purifier is running.
  • Outdoor reference values may be higher or lower than either indoor device depending on building tightness and filtration.

Reading differences are expected and can provide useful information about where to focus sealing, filtration, or ventilation efforts.

Scenario 3: Humidifier use in winter

A portable humidifier is used to raise humidity in a bedroom. A monitor sitting a few feet away shows repeated PM2.5 spikes when the humidifier runs.

  • Another monitor across the room shows milder changes or none at all.
  • The air does not necessarily look hazy, and there may be no obvious pollution source.

The spikes may reflect sensor response to small water droplets or changes in optical properties due to humidity, not an actual rise in harmful particles. Sensor design and placement explain why only one device shows significant spikes.

Safety, standards, and what “good enough” looks like

Home PM2.5 sensors are generally not certified for regulatory compliance or medical decisions. However, they can still support better indoor air practices when used with realistic expectations.

Understanding regulatory versus consumer measurements

Regulatory air quality networks typically rely on carefully calibrated instruments and long-term averaging to determine compliance with outdoor standards. Consumer PM2.5 monitors provide faster, more convenient insight but are not substitutes for these official measurements.

For home use, a sensor is often “good enough” if it:

  • Responds clearly to known sources and mitigation actions.
  • Shows relatively stable background values when conditions are steady.
  • Does not display erratic jumps without any environmental change.

Cautious use of add-on technologies

Some air-cleaning products use technologies such as ionization or UV-C. These may change how particles behave (for example, clumping together) or alter chemical composition. In some cases, PM2.5 readings can drop because particles are sticking to surfaces or forming larger particles, not necessarily because all contaminants are removed.

When using such technologies, interpret PM2.5 numbers as one part of the picture, alongside ventilation, filtration, and basic cleanliness. Avoid devices that intentionally generate ozone, especially in occupied spaces, as ozone is itself a respiratory irritant.

Maintenance and simple checks to keep PM2.5 readings reliable

Basic care can improve the stability and usefulness of your monitor’s readings, even if it cannot reach laboratory-level accuracy.

Keep air pathways clear

  • Dust or vacuum gently around the sensor’s air inlet and outlet according to the manual.
  • Avoid placing monitors where they can be blocked by books, curtains, or walls.
  • Do not tape or cover vents; this restricts airflow and biases readings.

Choose stable placement

  • Place the device on a solid surface 3–5 feet above the floor in the breathing zone.
  • Avoid direct sunlight, strong drafts, or immediate proximity to humidifiers.
  • Keep a moderate distance from air purifier outlets to avoid sampling unusually clean or turbulent air.

Perform occasional side-by-side checks

If you own more than one monitor:

  • Place them next to each other in a calm area for at least 30–60 minutes.
  • Ignore initial warm-up; compare readings once they have stabilized.
  • Note consistent offsets and mentally adjust expectations (for example, “Monitor A runs higher than Monitor B by about 20%”).

These checks help you decide which device to rely on more for trends without needing exact agreement.

Key air quality monitor metrics and common interpretation issues – Example values for illustration.
Metric What it indicates Common pitfalls Action idea
PM2.5 Fine particles from dust, smoke, cooking Treating small differences between devices as critical Watch trends; adjust filtration and indoor sources
PM10 Coarse dust and larger particles Confusing coarse dust with fine particle risks Use for cleaning and dust control routines
CO2 (non-safety range) Indicator of occupancy and ventilation effectiveness Interpreting as a direct pollution or health measurement Open windows or improve ventilation when persistently high
TVOC Combined volatile organic compounds Assuming it identifies specific chemicals Reduce strong chemical products; improve ventilation
Temperature Thermal comfort, HVAC operation Ignoring sensor lag near vents or windows Use multiple readings for whole-home comfort planning
Relative humidity Moisture level affecting comfort and mold risk Overreacting to short spikes near showers or humidifiers Aim for a moderate range and steady conditions

Example values for illustration.


Related guides: PM2.5 Explained: What the Numbers Mean and What’s a Safe Level IndoorsWildfire Smoke Indoors: Step-by-Step Plan to Lower PM2.5 FastAir Purifier Placement: Where to Put It for Best Results

Summary: Using PM2.5 sensors without overthinking the numbers

PM2.5 readings differ between devices for understandable reasons: variations in sensor design, calibration, aging, placement, humidity, and particle type all play a role. Consumer-grade monitors are built to show practical trends rather than to match each other or reference instruments perfectly.

For home use, you get the most value by watching how PM2.5 responds to your everyday activities and control steps: cooking, cleaning, opening windows, and running air purifiers or fans. Placing monitors thoughtfully, keeping them clean, allowing for warm-up and averaging, and cross-checking them occasionally will give you more trustworthy information than chasing exact alignment between devices.

With this perspective, PM2.5 sensors become a useful tool to guide ventilation and filtration decisions, complementing—not replacing—basic indoor air quality habits such as source control, regular cleaning, and sensible humidity management.

Frequently asked questions

Why do two home PM2.5 monitors show different readings?

Different devices use varying optical designs, calibration assumptions, sampling rates, and placement, and they respond differently to humidity and particle composition. These factors can cause real and expected differences even when both sensors are functioning correctly.

How can I check whether my PM2.5 sensor is working reliably?

Look for consistent responses to known activities (for example, a clear rise during cooking and a fall after running an air purifier), stable background values when conditions are unchanged, and no erratic jumps without environmental cause. An occasional side-by-side check after warm-up can reveal consistent offsets you can account for.

Is it useful to compare indoor sensor readings to outdoor reference data?

Outdoor regulatory data are helpful as a loose reference but use different instruments, averaging periods, and sampling conditions, so exact agreement is unlikely. Treat outdoor values as context rather than a strict calibration target for indoor consumer sensors.

How does humidity or using a humidifier affect PM2.5 readings?

High humidity or small water droplets from humidifiers can cause hygroscopic particles to swell or create droplets that scatter light, leading optical sensors to show spikes that may not reflect harmful particulate mass. To reduce false spikes, place monitors away from humidifier outlets and allow readings to stabilize after humidity changes.

Where should I place a PM2.5 monitor for the most representative indoor readings?

Place monitors on a stable surface about 3–5 feet above the floor, away from direct vents, windows, stoves, and humidifier outlets, and give devices 5–15 minutes to warm up. Avoid placing them directly in purifier outlets or confined corners and perform occasional side-by-side checks to understand any consistent offsets.

Where to Place an Air Quality Monitor: Practical Rules

Air quality monitor on living room desk with subtle airflow

Place an air quality monitor at breathing height in a regularly used room, away from direct drafts, heat sources, and tight corners so it can sample typical room air.

Good placement makes the readings more representative of the air you actually breathe. That usually means putting the monitor in the rooms you spend the most time in, at about sitting or standing height, and not pressed against walls, windows, or vents. A few simple rules about height, distance, and room choice go a long way.

Quick answer
  • Height: Aim for 3–6 ft above the floor (roughly breathing zone for adults when seated or standing).
  • Distance from walls: Keep 4–12 in from walls or large furniture so air can flow around the monitor.
  • Drafts and vents: Avoid placing directly in front of HVAC vents, fans, open windows, or doors.
  • Heat sources: Stay several feet away from stoves, ovens, radiators, and direct sunlight that can affect sensors.
  • Rooms: Prioritize bedroom and main living area; add kitchen and home office if possible.
  • Sampling spots: Use temporary spot checks (e.g., near cooking or cleaning) but rely on neutral locations for long‑term trends.

Why air quality monitor placement matters

An air quality monitor only measures the air right around its sensors. If it sits in a dead corner, right beside a window, or directly over a stove, its numbers may not reflect the air in the rest of the room. That can lead to either false alarms or a false sense of safety.

Indoor air is not perfectly mixed. Temperature differences, drafts, and obstacles create pockets where pollutants concentrate or disperse. Placement matters because monitors often track particulate matter (like PM2.5), carbon dioxide (CO2), and total volatile organic compounds (TVOCs), all of which can vary significantly from one spot to another.

Thoughtful placement helps you:

  • See realistic everyday exposure in rooms you use most.
  • Notice patterns from cooking, cleaning, and ventilation changes.
  • Judge whether air purifiers, open windows, or exhaust fans are having an effect.
  • Avoid misinterpreting readings caused by obvious, short-lived plumes (like right next to a candle).

Key height and distance rules for accurate readings

Most home air quality monitors are designed for indoor temperatures and normal humidity ranges, and they work best when air can move freely around them. Height and distance from surfaces both influence the air they sample.

Height: stay in the breathing zone

As a general rule, place the monitor near the height where people breathe most of the time in that room:

  • Living rooms and home offices: 3–5 ft above the floor (roughly seated head height).
  • Bedrooms: Near the level of your head when lying down or sitting up, often 2–4 ft if on a nightstand or shelf.
  • Open-plan areas: Anywhere in the 3–6 ft range that is easy to access and not blocked by furniture.

Very high or very low placements can bias readings. Close to the floor, the monitor may see more settled dust and less of the mixed room air. Near the ceiling, it may see warmer, lighter air that can be cleaner or more polluted depending on sources and airflow.

Distance from walls, corners, and objects

Monitors need space around them so air can flow freely across their inlets. Basic spacing guidance:

  • Walls and large furniture: Keep at least 4–12 in of clearance on all sides when possible.
  • Corners: Avoid tight corners where air movement is limited and dust can accumulate.
  • Bookshelves and cabinets: If on a shelf, avoid pushing it fully against the back wall; instead, pull it forward with a few inches of space.

This reduces the chance of stagnant air pockets or exaggerated readings from dust that collects on surfaces.

Avoid direct drafts, heat, and strong sources

Certain spots distort measurements by constantly blowing or heating the air at the sensor:

  • Do not place directly in front of: Supply vents, fans, portable heaters, or frequently opened doors.
  • Avoid strong heat sources: Stoves, ovens, radiators, sunny window sills, or electronics that get very warm.
  • Be careful with obvious sources: Candles, incense, printers, and cleaning products can be useful for short tests, but not for long-term placement.

Instead, choose a stable location where the monitor experiences the same general airflow you do when you sit or move around the room.

Table 1. Placement checklist for a home air quality monitor – Example values for illustration.
Key placement checks to improve everyday readings
Placement checkWhy it mattersSimple target
Height above floorAligns with typical breathing zoneAbout 3–6 ft (room dependent)
Distance from wallsPrevents stagnant air pockets4–12 in clearance if possible
Distance from vents/fansAvoids constant high or low readings from draftsAt least a few feet away
Distance from windows/doorsReduces swings from outdoor air and draftsSeveral feet from openings
Nearby heat sourcesHot air can affect sensors and skew dataNot directly above or beside heat
ObstructionsBlocks airflow to the sensing inletsKeep sides and top mostly open
Temporary test spotsHelps locate problem areasUse short tests, then return to neutral spot

Example values for illustration.


Room-by-room: which spaces to monitor first

Most homes have more potential monitoring spots than actual devices. It helps to prioritize the rooms where air quality changes most affect comfort and daily life.

Bedrooms: prioritize sleeping areas

People spend a large share of time in bedrooms, often with windows closed and doors partially shut. That can allow CO2, odors, and particles to accumulate higher than in more open areas.

Placement tips for bedrooms:

  • Place the monitor on a nightstand or dresser roughly at pillow height when you are lying down.
  • Keep it a foot or more away from the wall if space allows.
  • Avoid placing directly in the airflow of a nearby air purifier or fan pointed at the bed.
  • If you use scented products, avoid putting the monitor directly beside them to prevent constant high TVOC readings that reflect the product, not the room behavior.

Living rooms and family rooms

Living areas often combine several factors: more people, more movement, nearby kitchens, and sometimes gas appliances or fireplaces. They are good candidates for continuous monitoring.

Practical ideas:

  • Use a side table or media console at 3–5 ft height, with space at the back and sides.
  • Stay several feet away from burning candles or fireplaces for long-term placement.
  • In open-plan spaces, choose a central, regularly used area rather than a far corner.

Home offices and study areas

Home offices can have more electronic equipment, printers, and longer hours of occupancy. CO2 and VOCs from furniture, electronics, and office supplies can build up in smaller, closed rooms.

  • Place the monitor near your typical seated breathing height on a desk or shelf.
  • Avoid putting it directly in front of a vent or right above a computer exhaust fan.
  • If a printer is present, use the monitor for spot checks nearby during heavy use, then move it back to a neutral spot for baseline tracking.

Kitchens and cooking areas

Cooking can be a major source of particles and some gases indoors, especially when frying, broiling, or using high heat. A monitor can show how quickly those levels rise and fall and how well exhaust hoods and windows help.

For kitchens, balance realism with sensor protection:

  • Do not place the monitor directly above the stove or very close to pans where grease and moisture can coat sensors.
  • Instead, choose a nearby counter or shelf a few feet away from cooking surfaces, still within the same room.
  • Use the readings to observe the effect of range hoods, open windows, and closing doors to adjacent rooms.

Basements, laundry rooms, and utility spaces

These areas can have different air quality patterns due to dampness, stored items, and combustion appliances. If you suspect issues such as lingering odors or high humidity, a monitor can be rotated into these rooms for periodic checks.

  • Place the device off the floor on a stable surface at least a couple of feet high.
  • Avoid resting directly on appliances like dryers or water heaters.
  • Limit long-term placement in very humid areas if the monitor is not designed for that environment.

Common placement mistakes and how to avoid them

Even good monitors can give misleading numbers if placed poorly. Some common issues repeat across homes.

Too close to single strong sources

Putting a monitor right next to a specific source may show extreme values that do not reflect the room as a whole:

  • Directly beside air fresheners or scented products can keep TVOC readings elevated.
  • Right by a gas stove can overemphasize cooking episodes and expose the monitor to heat and grease.
  • Near a lit candle or incense stick can show persistent spikes that disappear a few feet away.

You can still use temporary placements to see local effects, but rely on a more neutral, central location for ongoing monitoring.

In stagnant or hidden spots

Monitors tucked behind curtains, inside cabinets, or behind televisions often show slower changes and may miss real spikes and drops.

  • Avoid fully enclosed spaces; the monitor should be in the same open air that you breathe.
  • Do not bury it among stacked books, boxes, or decorative items.
  • If the device has vents or grills, keep them unobstructed.

Permanent window sills and doorways

Placing a monitor in a window frame or directly next to a frequently opened door exposes it to rapid drafts and direct outdoor air. Readings may jump every time a breeze passes or someone enters.

Instead, position it a bit deeper into the room, where mixing between indoor and outdoor air has already begun, for a more stable picture of actual indoor conditions.

Over-interpreting a single location

No single spot in a home perfectly represents the entire space. A central monitor is useful, but different rooms can show different patterns, especially between floors or between open and closed rooms.

If possible, occasionally move the monitor for a day or two:

  • From the living room to the main bedroom.
  • From an upstairs room to the basement or lower level.
  • From a central area to near the kitchen during a period of frequent cooking.

This helps you understand where air quality tends to be better or worse and where additional ventilation or filtration might help.

Practical placement checklist for everyday use

Settling on a few simple rules makes monitor placement easy to repeat across rooms and over time.

Step 1: Choose your priority rooms

If you have a single monitor, prioritize:

  • The main bedroom, or
  • The main living/family room or open-plan area.

With two or more monitors, add the home office, kitchen, or a lower-level room like a basement that behaves differently from the rest of the house.

Step 2: Pick a stable surface and height

Use a steady piece of furniture that does not shake or vibrate frequently:

  • Side table, dresser, sturdy shelf, or desk.
  • Height near your normal breathing zone in that room (generally 3–6 ft).

Avoid placing on vibrating appliances or where children or pets can easily knock the monitor over.

Step 3: Check distance from walls and vents

Before you settle on a spot, quickly check:

  • Wall clearance: leave a small gap so air can circulate around the back.
  • Vents/fans: avoid direct paths from a vent, fan, or portable heater to the monitor.
  • Windows/doors: several feet away from large, frequently used openings is usually better for long-term data.

Step 4: Use short-term tests for specific questions

You can temporarily move the monitor to investigate specific situations:

  • Near a bathroom after showers to see how humidity behaves.
  • In the kitchen during typical cooking sessions to compare with and without the exhaust fan.
  • Closer to stored items, paints, or cleaning supplies to see if they significantly raise TVOCs.

After short tests, return the monitor to its usual neutral spot so your long-term trends remain comparable.

Step 5: Revisit placement when your home changes

Changes in furniture layout, additional air purifiers, new fans, or sealing up drafts can all alter room airflow. If readings shift unexpectedly after such changes, it can be worth reevaluating the monitor location rather than assuming the entire home air has changed to the same degree.

Using readings to troubleshoot air quality and airflow

Once your monitor is in a sensible location, its readings can help you understand how your home responds to everyday activities and simple interventions.

Identifying patterns by time of day

Look for repeated patterns:

  • Evening CO2 increases when more people are home and windows are closed.
  • Regular PM2.5 spikes during cooking times or when vacuuming.
  • TVOC rises after specific activities like cleaning or using craft materials.

Consistent patterns can guide when to open windows, run exhaust fans, or use air purifiers more actively.

Checking the effect of ventilation

Try simple experiments from your chosen monitor location:

  • Open a window or door and watch how quickly particulate or CO2 levels change.
  • Turn on a kitchen or bathroom exhaust fan and see if pollutant peaks shorten.
  • Compare nights with the bedroom door open versus closed.

These comparisons help you understand which ventilation actions have the most noticeable impact in your specific home.

Understanding what different metrics can and cannot show

Home monitors often report several metrics, each with limitations:

  • PM2.5 and other particle counts: Indicate fine particles from dust, cooking, smoke, and outdoor air, but not their exact composition.
  • CO2: Often used as an indicator of how much fresh air is mixing in compared with exhaled air, but it does not identify specific pollutants.
  • TVOC: Represents a combined signal from many volatile compounds; it responds to numerous everyday products and materials and cannot distinguish between them.

Placement that avoids direct contact with single strong sources makes these metrics more useful for tracking overall trends.

Simple care and maintenance for consistent readings

Monitor placement is only part of getting consistent data; basic upkeep also matters. Dust and film on inlets or sensors can gradually affect performance, especially in areas with a lot of cooking or traffic.

Keep inlets clear and clean

Most monitors have small openings for air to reach the sensors. Over time, these can collect dust.

  • Lightly dust the exterior with a dry cloth as needed.
  • Avoid spraying cleaners, air fresheners, or water directly on the device.
  • Do not block vents with fabrics, paper, or decorative items.

Respect environmental limits

Check the general environmental range the device is designed for, especially humidity and temperature.

  • Do not place permanently in very damp environments if not intended for that use.
  • Avoid very hot spots, such as directly above radiators or heaters.
  • If you use humidifiers or dehumidifiers, avoid aiming airflow directly at the monitor.

Re-evaluating placement over time

If readings look unusual or do not match your observations, re-check placement before assuming a major indoor air change.

  • Look for newly added heat sources, fans, or furniture blocking airflow.
  • Try moving the monitor a few feet and watching how readings respond over a day or two.
  • Note any seasonal changes, such as more closed windows in winter or heavy use of air conditioning in summer.

Common questions about placing an air quality monitor

Can I mount an air quality monitor on the wall?

Many monitors can work on a wall as long as they are within the breathing zone and not at the very top of the ceiling. Aim for around 3–5 ft above the floor on a central wall, with some clearance on all sides and away from vents or windows.

Is it better to put a monitor near an air purifier?

For long-term trends, it is usually better to keep the monitor out of the direct airflow from a purifier. Placing it several feet away in the same room helps you see how the overall air changes, rather than only the air right in front of the purifier.

Should I leave the monitor in one place or move it around?

Both approaches can be useful. Keeping the monitor in one place helps you build a clear baseline and watch trends over time. Periodically moving it to other rooms for a day or two can reveal differences between areas and help you target ventilation or filtration where it is most needed.

What if my home has more than one floor?

Air quality can differ between levels, especially when basements or attics are involved. If you have one monitor, place it where you spend the most time or where you have the most questions, then occasionally move it between floors. With multiple monitors, one on each frequently used floor can provide a fuller picture.

Does placing a monitor near a plant affect readings?

Normal houseplants usually have only a minor effect on measurements compared with overall room airflow and other sources. However, placing a monitor directly between several large plants or very close to damp soil may slightly influence humidity readings. In most cases, a small distance from plants is enough.

Table 2. Home monitor metrics and how placement affects them – Example values for illustration.
Monitor metrics guide with placement considerations
MetricWhat it generally indicatesCommon placement pitfallsAction idea
PM2.5 / particle levelsFine particles from dust, cooking, smokeRight next to stoves, candles, or vacuums exaggerates spikesPlace centrally; use short tests near sources when needed
CO2Build-up of exhaled air vs. fresh air mixingDirectly in draft from window or vent causes rapid swingsUse a stable spot away from strong drafts
TVOCCombined signal from many volatile compoundsBeside air fresheners or cleaners skews baseline highKeep some distance from strong fragrance or chemical sources
TemperatureLocal thermal comfort and heat patternsAbove radiators or electronics runs higher than room averagePlace away from heaters; use breathing-height level
Relative humidityMoisture level in room airRight next to humidifiers, dehumidifiers, or steamy showers distorts readingsMove farther from moisture sources, still in same room
Combined index scoresSummary of several measurementsPoor placement in one metric (e.g., TVOC near product) affects overall scoreFocus on neutral, representative locations for long-term tracking

Example values for illustration.


Related guides: Air Purifier Placement: Where to Put It for Best ResultsHow to Choose the Right Air Purifier for Your Room SizePM2.5 Explained: What the Numbers Mean and What’s a Safe Level Indoors

Key takeaways on monitor height, distance, and rooms

For most homes, a practical approach is enough to get useful air quality data. Place your monitor where you actually spend time, at roughly breathing height, and with a little space around it so air can move freely. Avoid vents, windows, strong heat sources, and direct contact with single strong sources like candles or cleaning products for long-term placement.

Use central, stable spots in main bedrooms and living areas for ongoing trends, and move the monitor occasionally for targeted checks in kitchens, offices, or basements. With these straightforward height, distance, and room choices, the numbers you see are more likely to match the air you are actually breathing.

Frequently asked questions

Where should I place an air quality monitor in a small bedroom?

Place the monitor on a stable nightstand or dresser at roughly pillow height (about 2–4 ft), and leave at least a foot of clearance from the wall. Keep it away from vents, fans, or direct airflow from purifiers so it reflects typical breathing air rather than a local plume.

Can I put an air quality monitor on a windowsill or directly by a frequently opened door?

Placing a monitor on a windowsill or next to a frequently opened door is not recommended for long-term monitoring because drafts and outdoor air create rapid swings. If you want to test outdoor infiltration briefly, a short-term placement near the opening is fine, but move the device deeper into the room for stable baseline data.

How far from an air purifier should I place the monitor to see overall room air quality?

For long-term trends, place the monitor several feet away and out of the purifier’s direct airflow (typically 3–6 ft) so it measures the mixed room air. If you want to test how well the purifier cleans the nearby air, use a short-term placement directly in its outlet for the duration of that experiment.

Will placing a monitor near houseplants affect readings?

Normal houseplants usually have only a minor effect on readings compared with room airflow and major sources. Very large clusters of plants or wet potting soil placed immediately against the sensor can slightly influence humidity or local VOC readings, so keep a small gap for representative results.

How often should I move a single monitor to understand whole-home air quality?

Keep the monitor in one spot for weeks to build a reliable baseline, then move it for 24—72 hours to other priority rooms when you want comparison data. If your home layout or ventilation changes, repeat short relocations to verify whether those changes changed overall patterns.

ERV vs HRV: What They Do for Indoor Air Quality

Isometric illustration of home ventilation with fresh air flow

Energy recovery ventilators (ERVs) and heat recovery ventilators (HRVs) both bring in outdoor air and exhaust stale indoor air while transferring heat between the two air streams to support indoor air quality and comfort.

They are balanced mechanical ventilation systems designed to improve air exchange without wasting as much heating or cooling energy as simply opening windows. Understanding how each handles heat, moisture, and different climates helps you choose the option that fits your home and comfort needs.

Quick answer
  • Both ERVs and HRVs improve indoor air quality by bringing in filtered outdoor air and exhausting stale indoor air.
  • HRVs transfer heat only; ERVs transfer both heat and some moisture between incoming and outgoing air.
  • HRVs are often favored in colder, drier winter climates; ERVs are often favored where indoor air tends to get too dry or summers are humid.
  • Typical whole‑house systems aim for about 0.3–0.5 air changes per hour (ACH) as a general ventilation target.
  • ERV/HRV systems support, but do not replace, good filtration (for particles), humidity control, and source control of pollutants.

What ERVs and HRVs Are and Why They Matter

Modern homes are often tightly built, which is good for energy efficiency but can trap indoor pollutants such as cooking emissions, cleaning product vapors, and general household odors. Mechanical ventilation with heat or energy recovery provides a predictable way to exchange indoor and outdoor air while reducing the energy penalty.

An HRV transfers heat from the warmer air stream to the cooler one. In winter, it pre-warms incoming cold air using heat from outgoing indoor air; in summer, it can help pre-cool incoming warm air. An ERV does the same but also transfers a portion of moisture (water vapor) between the air streams through a special core.

Both systems can help:

  • Reduce buildup of indoor carbon dioxide (CO₂) from people breathing.
  • Dilute indoor-generated pollutants and odors.
  • Support more stable humidity when matched appropriately to climate and house conditions.
  • Lower the need to open windows in extreme hot or cold weather.

Key Concepts: How ERVs and HRVs Work

ERVs and HRVs are typically ducted systems with two main air paths: outdoor air coming in and indoor air going out. The air streams pass through a core that allows heat (and in ERVs, some moisture) to transfer between them without mixing the actual air.

Basic airflow pattern

  • Supply side: Outdoor air is pulled in, passes through filters and the core, and is delivered to living areas.
  • Exhaust side: Stale air from bathrooms, kitchens (not usually the main cooking range hood), or central locations is pulled out and passed through the core before going outside.
  • Balanced flow: ERVs/HRVs are generally designed so supply and exhaust airflow are similar, helping keep indoor pressure near neutral.

Heat transfer vs moisture transfer

  • HRV: Transfers sensible heat (temperature). Moisture mostly stays where it is.
  • ERV: Transfers sensible heat and some latent heat (moisture). Moisture migrates from the more humid air stream toward the drier one.

In winter, an ERV may help keep indoor humidity from dropping as quickly by transferring moisture from outgoing humid indoor air back into incoming dry outdoor air. In humid summers, it can reduce the amount of moisture brought into the house by transferring some of that moisture to the outgoing indoor air stream.

Ventilation and indoor air quality basics

Mechanical ventilation helps maintain indoor air quality by providing a reasonably steady air change rate. A commonly cited planning range for continuous residential ventilation is around 0.3–0.5 air changes per hour (ACH) as a general target, but actual needs depend on home size, occupancy, and local codes.

An ERV or HRV focuses on fresh air and dilution. It is not a direct substitute for:

  • High-efficiency filtration for particles such as dust and smoke (HEPA or good furnace filters).
  • Dedicated humidity control devices like dehumidifiers or humidifiers when conditions are extreme.
  • Source-specific exhaust (e.g., kitchen range hoods and bathroom fans) for moisture and odors.
Table 1. ERV vs HRV comparison for indoor air quality and comfort

Example values for illustration.

Key differences between ERVs and HRVs in typical home use
Aspect HRV ERV
What is transferred Heat only Heat and some moisture
Main ventilation goal Fresh air with heat recovery Fresh air with heat and moisture moderation
Typical climate fit (example) Cold, relatively dry winters Humid summers or very dry winters
Indoor humidity effect (winter) Indoor air can dry out faster Helps retain more indoor moisture
Indoor humidity effect (humid summer) Brings in outdoor humidity Can reduce humidity load on AC
Filter role Protects core and fans, basic particle control Same; may have similar filter needs
Common IAQ benefit Dilutes indoor pollutants effectively Dilutes pollutants and moderates dryness/humidity

Choosing Between ERV and HRV: Key Sizing and Climate Logic

Choosing between an ERV and an HRV is largely about climate, how tight and insulated the home is, and how your household tends to operate. Sizing is about matching airflow to house volume and expected occupancy.

Climate and humidity considerations

  • Cold, dry winter climates: HRVs are commonly used. Indoor air can get quite dry in winter; some homeowners prefer ERVs here to help retain moisture, but this can depend on how humid the indoor air already is from cooking, showers, and occupancy.
  • Humid summer climates: ERVs are often favored because they can reduce the amount of moisture that enters the home with fresh air, helping air conditioning work more efficiently.
  • Mixed climates: Either can work. The choice may come down to how often humidity is too high vs too low and whether comfort or energy considerations are prioritized.

Basic airflow sizing ideas

Ventilation rates are often set based on:

  • Home floor area and ceiling height (total volume).
  • Number of occupants or bedrooms as a proxy.
  • Local code or standard references that provide minimum continuous ventilation rates (for example, a target cfm per square foot or per person).

A common planning approach is to target a whole-house ACH of roughly 0.3–0.5 for continuous mechanical ventilation, with higher rates in smaller, more heavily occupied homes. This is a general range, not a strict rule, and local codes or standards may differ.

How ERVs/HRVs interact with other systems

  • With central heating/cooling: Systems can be ducted to supply air to main trunks or dedicated supply grilles. Coordination helps distribute fresh air evenly.
  • With exhaust fans: Bathroom fans and range hoods are still useful for short bursts of higher exhaust when cooking or showering.
  • With portable air purifiers: ERVs/HRVs manage fresh air; purifiers manage particles and some gases in specific rooms.

Common Mistakes and Troubleshooting Cues

Even a well-chosen ERV or HRV can underperform if installed or operated incorrectly. Many issues are related to airflow balance, duct design, and maintenance.

Frequent pitfalls

  • Improper sizing: An undersized unit may not provide enough fresh air; an oversized unit may increase drafts and energy use if not controlled well.
  • Poor duct layout: Long, restrictive ducts, sharp bends, or too many branches can reduce actual airflow compared to the unit’s rating.
  • Imbalanced supply and exhaust: If exhaust is much higher than supply, the home can become slightly depressurized; if supply dominates, it can become slightly pressurized. Either condition can affect comfort and building envelope performance.
  • Dirty or missing filters: Clogged filters reduce airflow and stress fans; missing filters allow dust and debris into the core.
  • Incorrect control settings: Running on very low speed constantly may not provide enough ventilation during high-occupancy periods; running on high speed unnecessarily may waste energy.

Signs something may need attention

  • Persistent odors in living areas despite the system running.
  • Condensation on windows or walls in cold weather, suggesting high indoor humidity and insufficient air exchange.
  • Very dry air (static shocks, dry throat) in winter when using an HRV at high rates in a dry climate.
  • Unusual noises from the unit or ductwork, indicating airflow or mechanical issues.
  • Noticeably dusty filters shortly after cleaning or replacement, indicating heavy dust load that might call for more pre-filtration or cleaning of ducts and intakes.

Practical Guidance: How to Decide and What to Ask For

Before choosing an ERV or HRV, it helps to clarify your main comfort concerns and how your home behaves through the seasons.

Questions to consider

  • Does your home feel too dry in winter (nose, skin, static), or does it feel stuffy and humid with condensation on windows?
  • Is your region known for long, humid summers with heavy air conditioning use?
  • Is the house new and tight, or older and somewhat leaky?
  • How many people usually occupy the home, and are they home most of the day?
  • Are there specific indoor air quality goals, such as reducing cooking odors or supporting comfort for people with sensitivities to poor air quality?

Simple decision tendencies

These are general tendencies, not rigid rules:

  • Leaning toward HRV: Cold climate, winter indoor humidity generally acceptable or high, main goal is steady fresh air with efficient heat recovery.
  • Leaning toward ERV: Humid summers, house often feels muggy, or winters are so dry that some moisture recovery would be helpful.
  • Either could work: Moderate climate, no extreme humidity issues, main goal is predictable fresh air and energy savings.

What to discuss with a professional

  • Expected ventilation rate in cfm and corresponding ACH for your home size.
  • Location of supply and exhaust grilles for good distribution.
  • Filter types and sizes, and how easy they are to access.
  • Drainage needs (if any) and service access for the core.
  • Control strategy: continuous low-speed, intermittent high-speed, or demand-based control (for example, linked to occupancy or humidity sensors).

Real-World Examples: ERV vs HRV in Different Homes

Looking at typical scenarios can make the ERV vs HRV choice more concrete. These are simplified examples; actual decisions should reflect specific home details.

Example 1: Cold, dry winter region

A well-insulated house in a region with long, cold winters and low outdoor humidity uses a high-efficiency furnace. The homeowners notice winter air feels dry but manageable, and the main complaint is stuffy air with closed windows. An HRV might be selected to provide steady fresh air and heat recovery, with the option to add a humidifier if indoor air becomes uncomfortably dry.

Example 2: Humid summer, air-conditioned house

A tight, newer home in a warm, humid climate relies heavily on air conditioning in summer. Indoor air can feel muggy when windows are closed for long periods. An ERV may help by reducing the moisture that enters with outdoor air, supporting the air conditioner’s ability to control humidity and maintaining more comfortable indoor conditions.

Example 3: Mixed climate, concern about dryness

A family in a mixed climate region experiences both cold winters and humid summers. They run heat in winter and central air in summer. Winter air feels uncomfortably dry when the furnace runs often. In this case, an ERV might be chosen over an HRV to moderate winter dryness while still helping with humidity during humid periods.

Example 4: Older, somewhat leaky house

An older home with noticeable drafts may already have significant uncontrolled air exchange. Here, the first step may be to improve air sealing and basic exhaust ventilation. After tightening the house, adding an ERV or HRV can then provide controlled, balanced ventilation that is easier to size and manage.

Safety, Standards, and Indoor Air Quality Considerations

ERVs and HRVs are generally considered safe when properly installed and maintained, but there are important safety and standards-related points to keep in mind.

Combustion appliances and backdrafting

Homes with combustion appliances such as gas furnaces, boilers, or water heaters need to be evaluated for potential backdrafting risks. An imbalanced ventilation system that depressurizes the home could affect how combustion byproducts are exhausted. Building codes and best practices typically require attention to pressure balance and proper venting of combustion appliances.

Filtration and outdoor air quality

Because ERVs and HRVs bring in outdoor air, the quality of that air matters. When outdoor air is affected by wildfire smoke, heavy traffic, or other pollution events, filters on the intake become especially important. Many units use standard-sized filters that can be selected in different efficiency ratings, but very high-efficiency filters can add resistance and reduce airflow if the fan and duct design do not account for them.

Ozone, ionizers, and UV-C add-ons

Some ventilation or duct-related products may include optional features such as ionizers or UV-C lights. These technologies are separate from the core function of ERVs and HRVs.

  • Ozone: Intentional ozone generators are generally not recommended for occupied spaces due to potential respiratory irritation.
  • Ionizers: Ionization devices may affect particle behavior but can have byproducts; performance and safety can vary.
  • UV-C: UV-C lamps are used in some systems for surface disinfection or coil cleanliness but need proper shielding, mounting, and maintenance to avoid direct exposure.

If such features are considered, it is reasonable to ask for data from recognized testing where available and to ensure they do not interfere with basic ventilation performance or maintenance.

Maintenance and Upkeep: Keeping ERVs and HRVs Effective

Regular maintenance supports both indoor air quality and equipment longevity. Most tasks are straightforward but need to be done consistently.

Routine tasks

  • Filter cleaning/replacement: Inspect filters every 1–3 months at first, then adjust the schedule based on how quickly they load with dust. Replace or clean according to manufacturer instructions.
  • Core inspection: The heat or energy recovery core should be checked periodically for dust buildup and cleaned as specified. Some cores are washable; others must be handled more carefully.
  • Intake and exhaust grilles: Outdoor hoods and screens can accumulate leaves, insects, or dust. Clear obstructions to maintain airflow.
  • Condensate management: Some systems produce condensate, especially in cold weather. Ensure any drain lines are clear.
  • Controls and settings: Periodically verify that timers, speed settings, or any demand controls still match how the home is used.

Signs maintenance may be overdue

  • Noticeable decrease in airflow from supply or exhaust grilles.
  • Increased noise from the unit or ducts.
  • Visible dust buildup on intake screens or around grilles.
  • Musty odors from the unit or ducts when the system starts.

Building ERV/HRV checks into seasonal home maintenance (for example, spring and fall) can keep ventilation performance more consistent.

Table 2. Filter and component replacement planner for ERV/HRV systems

Example values for illustration.

Typical maintenance intervals and what can change them
Component Typical interval range What changes it Reminder
Intake/exhaust pre-filters 1–3 months Dusty area, pollen season, nearby traffic Check monthly at first to set a pattern
Main ERV/HRV filters 3–6 months Filter efficiency, indoor dust sources Mark change dates on a calendar
Heat/energy recovery core cleaning 6–12 months Outdoor air quality, filter performance Inspect annually, clean as needed
Outdoor intake hood and screens 2–4 times per year Leaves, insects, wind-blown debris Combine with seasonal yard cleanup
Fan and motor inspection Every 1–2 years Operating hours, dust loading Listen for changes in sound or vibration
Professional system check Every 1–3 years Age of system, complexity of ducting Verify airflow balance and overall function

Related guides: Ventilation vs Air Purifier: When You Need One, the Other, or BothCO2 Ventilation Calculator: Fresh-Air Needs for BedroomsAir Purifier vs Ventilation: Which Fixes Stuffy Bedrooms Better?

Summary: What ERVs and HRVs Do for Indoor Air Quality

ERVs and HRVs improve indoor air quality by providing balanced, controlled ventilation that exchanges indoor and outdoor air while recovering heat, and in the case of ERVs, some moisture. This helps dilute indoor pollutants, manage odors, and maintain more stable temperature and humidity compared with simple exhaust-only systems or opening windows in extreme weather.

Choosing between ERV and HRV mainly comes down to climate and comfort goals. HRVs focus on heat recovery and tend to fit cold, drier climates, while ERVs add moisture transfer that can be helpful in humid summers or very dry winters. In all cases, ventilation works best alongside good filtration, sensible humidity control, and regular maintenance, forming a practical foundation for cleaner, more comfortable indoor air.

Frequently asked questions

How does an ERV differ from an HRV in managing indoor humidity?

An ERV transfers both sensible heat and some moisture between incoming and outgoing air streams, which can help retain indoor humidity in dry winters or reduce incoming moisture in humid summers. An HRV transfers mainly sensible heat and does not actively move significant moisture, so it has less effect on indoor humidity levels.

Which should I choose for a house in a humid-summer climate: ERV or HRV?

In humid-summer climates an ERV is often preferred because it can reduce the moisture load brought in with outdoor air, easing the work of air conditioning. However, the best choice depends on the home’s tightness, existing humidity issues, and a professional assessment of ventilation needs.

Can ERVs or HRVs help when outdoor air has wildfire smoke or heavy pollution?

ERVs and HRVs bring in outdoor air through intake filters, so filter efficiency affects how much smoke or particles enter the home. Using higher-efficiency filters and adding portable HEPA air cleaners can substantially reduce indoor smoke particles; very high-efficiency filters can increase system resistance and should be evaluated against the unit’s fan capability.

Will installing an ERV or HRV create backdrafting problems with combustion appliances?

Properly designed and balanced ERV/HRV systems aim to keep supply and exhaust nearly equal, minimizing pressure shifts that can cause backdrafting. Homes with combustion appliances should be evaluated for venting and pressure interactions before installation, and professionals can perform pressure and combustion-safety checks.

How often should I change filters and clean the core on an ERV/HRV?

Inspect intake pre-filters every 1–3 months and main unit filters roughly every 3–6 months depending on dust loading; the recovery core is commonly inspected and cleaned every 6–12 months. Regular checks of intake hoods and a professional system check every 1–3 years help maintain performance.

Air Exchange Basics Explained: ACH, Leaks and Stuffy Rooms

Isometric living room showing simple home ventilation airflow

Air exchange is the process of replacing indoor air with outdoor air, and it explains why rooms can feel fresh, balanced, or stuffy depending on how quickly that exchange happens.

In homes, air exchange comes from a mix of intentional ventilation (fans, open windows, ducts), unintentional leaks (called infiltration), and sometimes air-cleaning devices that recirculate and filter the same air. Understanding a few basic concepts—air changes per hour (ACH), infiltration, and typical airflows—makes it easier to troubleshoot a stuffy room and choose practical fixes like ventilation, filtration, or both.

Quick answer
  • For general comfort, many homes feel better around 0.35–0.5 air changes per hour (ACH) as a broad planning target, not a strict limit.
  • “Stuffy” usually means low fresh air plus a buildup of human byproducts (moisture, CO₂, odors) or pollutants from indoor sources.
  • Older, leakier homes rely heavily on infiltration (air leaking through cracks); newer tight homes often need mechanical ventilation.
  • Air purifiers improve particle levels but do not add fresh outdoor air; they do not fix low-ventilation stuffiness by themselves.
  • Simple checks—humidity, condensation, lingering odors, how you feel in the room—can flag low air exchange.
  • Practical steps include using exhaust fans, opening windows when reasonable, balancing doors, and sizing filtration by room volume and target ACH.

What Air Exchange Means and Why It Matters

Air exchange describes how often the air in a room or building is replaced with air from outside. It is usually expressed as air changes per hour (ACH), meaning how many times in an hour the entire volume of air in a space is effectively replaced.

In a home, air exchange matters for three main reasons:

  • Freshness and comfort – Replacing stale air dilutes carbon dioxide, odors, and moisture from breathing, cooking, and bathing.
  • Moisture balance – Ventilation helps prevent persistent dampness that can contribute to condensation and mold risk.
  • Pollutant dilution – Ventilation dilutes some indoor pollutants from activities and materials, while filtration can reduce particles circulating indoors.

When air exchange is too low for the way a room is used, people often describe it as “stuffy,” even if the temperature looks normal. That sensation usually reflects a mix of rising CO₂, humidity, and odors that are not being cleared quickly enough.

Key Concepts: ACH, Infiltration, and Ventilation

To understand why a space feels fresh versus stuffy, it helps to separate a few key ideas.

Air Changes per Hour (ACH)

ACH is a simple way to describe how quickly air is exchanged. The basic idea:

  • Higher ACH = faster air turnover, more dilution of indoor-generated pollutants.
  • Lower ACH = slower air turnover, more buildup of CO₂, odors, and humidity.

A rough planning example for a living space might be around 0.35–0.5 ACH of outdoor air as a comfort-oriented target, recognizing that actual needs vary with climate, occupancy, and how a home is built and operated. Some bedrooms, for example, may feel more comfortable at higher effective air exchange when heavily occupied at night.

Infiltration vs. Mechanical Ventilation

Infiltration is unintentional air leakage through cracks, gaps, and porous building materials. It is driven mainly by wind and temperature differences between indoors and outdoors.

Mechanical ventilation is intentional air exchange using fans or ducted systems. Common examples include:

  • Bathroom and kitchen exhaust fans that remove moist or stale air.
  • Whole-house ventilation systems that bring in filtered outdoor air and exhaust indoor air.
  • Balanced systems that deliver and remove air in roughly equal amounts.

Older homes often get a surprising amount of air exchange from infiltration alone, especially in cold or windy weather. Newer, “tighter” homes can have very low infiltration, which may be helpful for energy use but often requires deliberate mechanical ventilation for comfort.

Air Purifiers and Recirculation ACH

Air purifiers do not bring in fresh outdoor air. They recirculate indoor air through filters to remove particles (and sometimes gases, depending on filter type). Even though this is not outdoor air exchange, people often talk about a purifier delivering a certain number of “air changes per hour” in a room.

This purifier ACH is different from ventilation ACH:

  • Ventilation ACH – how often indoor air is replaced with outdoor air.
  • Purifier ACH – how many room-volumes per hour are passed through the device’s filters.

Purifier ACH can greatly reduce particle levels (dust, smoke, etc.), but if the underlying ventilation ACH is low, the room can still feel stuffy because CO₂ and some gases are not reduced as effectively.

Table 1. Choosing between ventilation, filtration, or both – Example values for illustration.
Situation Ventilation focus? Filtration focus? Notes (example thinking)
Room feels stuffy but looks clean High Low to medium Increase outdoor air (fans, windows) to dilute CO₂ and odors.
Visible dust and allergy triggers Medium High Use effective filtration plus reasonable ventilation.
Cooking odors linger for hours High Medium Use exhaust fans and possibly carbon filtration.
Wildfire smoke outside Low to medium High Limit outdoor intake when smoke is heavy; use strong filtration.
Humid bathroom after showers High Low Run exhaust fan long enough to clear moisture.
New furnishings with noticeable smell Medium to high Medium Increase fresh air; consider gas-adsorbing filters if needed.
Bedroom used by multiple people nightly Medium Medium to high Combine steady ventilation with quiet filtration.

Example values for illustration.

Why “Stuffy” Happens: Common Causes and Cues

A stuffy room usually does not have a single cause. It often reflects a combination of low ventilation, ongoing indoor emissions, and how the space is used.

Low Outdoor Air per Person

Each person in a room exhales carbon dioxide and water vapor and adds body odors. If fresh air coming in is low compared with the number of people and the time they spend there, levels build up. Common cues include:

  • Room feels fine at first, then stuffy after an hour or two of occupancy.
  • Air feels noticeably better quickly when a window is opened or an exhaust fan is used.

Closed Interior Doors and Poor Airflow Paths

Even if a home has central heating or cooling, closed doors can trap air in rooms without a clear path back to the main return. Signs include:

  • Bedroom feels fresher with the door slightly open.
  • Temperature is acceptable, but air feels stagnant or heavy.

Humidity and Odors that Linger

Moisture and odor behavior can signal low air exchange:

  • Bathroom mirror stays foggy long after a shower.
  • Cooking smells remain for many hours.
  • Musty or “old” smell in closed rooms or basements.

These conditions suggest the space is not clearing moisture and gases quickly enough.

Seasonal and Weather Effects

Infiltration varies with weather. Some patterns:

  • Winter in cold climates – Stack effect (warm air rising) can increase uncontrolled leakage, sometimes making homes less stuffy but more drafty.
  • Mild seasons with closed windows – Heating or cooling may run less, fans cycle less, and air can become more stagnant.
  • Hot, humid summers – People often seal up homes and rely on air conditioning. If outdoor air intake is low, rooms can feel closed-in despite cool temperatures.

Practical Steps to Improve Air Exchange and Comfort

Most homes can improve perceived freshness with a combination of simple ventilation habits and targeted filtration. The right mix depends on climate, building type, and any outdoor air quality concerns.

Use Existing Exhaust Fans Effectively

Bathroom and kitchen exhaust fans are straightforward tools for moving stale, humid, or odor-laden air outside.

  • Run bathroom fans during showers and for 15–30 minutes afterward to help clear moisture.
  • Use range hoods while cooking, especially for frying, searing, or heavy odor foods.
  • If fans are noisy, people tend to avoid them; consider running them for shorter but more frequent periods if that is more acceptable.

Window and Cross-Ventilation Strategies

When outdoor conditions are reasonable (temperature and outdoor air quality both acceptable), opening windows can rapidly increase air exchange.

  • Create cross-ventilation by opening windows on opposite sides of a home or room.
  • Use interior doors strategically to let fresh air move through while maintaining privacy where possible.
  • Even short “air-out” periods—5–15 minutes—can make a noticeable difference in stuffy rooms.

Balancing Doors and Returns

For homes with central HVAC, verify that air has a way to travel back to the main return:

  • Leave bedroom doors slightly open when practical.
  • Use undercut doors or transfer grilles where appropriate to help air move.
  • Avoid blocking supply or return registers with furniture or large objects.

Pair Ventilation with Filtration

Ventilation dilutes indoor-generated gases and moisture; filtration reduces particles. Used together, they often produce better comfort than either alone.

  • Use air purifiers or high-efficiency central filters to control dust and fine particles.
  • Use activated carbon or similar media when odors or some gases are a concern, recognizing that these filters have finite capacity.
  • During outdoor smoke or high-pollen events, adjust windows and outdoor intake to limit contaminants while maintaining enough air exchange for comfort, often leaning more on indoor filtration.

Real-World Home Scenarios

These example situations illustrate how ACH, infiltration, and usage patterns interact in everyday spaces.

Scenario 1: Stuffy Bedroom at Night

A small bedroom with one or two people sleeping and the door closed can quickly feel stuffy, especially in tighter homes.

Possible responses:

  • Crack the door or window slightly if conditions allow.
  • Run a quiet fan to improve mixing and movement between the room and the rest of the home.
  • Use an air purifier to reduce particles; pair with ventilation changes to address CO₂ and odors.

Scenario 2: Odors in an Open-Plan Living Area

Cooking in an open-plan kitchen and living room can spread odors widely. If there is limited exhaust or window opening, smells may linger for hours.

Possible responses:

  • Use the range hood or nearby exhaust fan during and after cooking.
  • Open a window downwind and another across the room to encourage cross-flow if outdoor air is acceptable.
  • Run filtration in the main space to reduce particles created during cooking.

Scenario 3: Finished Basement with Musty Smell

Basements often have lower natural air exchange and more moisture sources from soil and concrete surfaces.

Possible responses:

  • Improve drainage and moisture control where needed to reduce persistent dampness.
  • Use dehumidification to keep relative humidity in a generally comfortable range, often around 30–50% as a broad target.
  • Add ventilation where feasible, and use filtration to address particles; consider gas-adsorbing media for musty odors.

Safety, Equipment Choices, and Neutral Technologies

When adding devices to manage air quality, it is useful to distinguish between approaches that physically remove pollutants and those that rely on chemical or electrical reactions.

Filtration and Ventilation First

Physical methods tend to be straightforward to understand:

  • Mechanical filtration – HEPA and other high-efficiency filters capture fine particles by passing air through dense media.
  • Activated carbon or similar media – Adsorb some gases and odors on surfaces within a porous material.
  • Plain ventilation – Dilutes indoor air by mixing with outdoor air, sometimes with heat or energy recovery.

Ionizers, UV-C, and Ozone Considerations

Some devices use ionization, UV-C light, or related methods. These technologies may be marketed with various claims, but they can have complexities:

  • Ionizers – Charge particles to help them settle or clump together. Some designs may generate small amounts of ozone as a byproduct.
  • UV-C – Used inside ducts or devices mainly to act on microorganisms on coils or in passing air. Effectiveness depends on dose and exposure time.
  • Ozone generators – Devices that intentionally produce ozone are not appropriate for occupied living spaces because ozone is a lung irritant.

For most homes, starting with simple, well-understood methods—ventilation, filtration, humidity control, and source management—is a practical baseline before considering more complex technologies.

Maintenance, Monitoring, and Ongoing Checks

Maintaining filters, fans, and basic monitoring habits helps keep air exchange effective over time.

Fans and Ducts

  • Clean exhaust fan grilles periodically so dust buildup does not reduce airflow.
  • Listen for changes in fan noise that might signal worn parts or obstructions.
  • If a fan seems weak, its duct run or termination hood may need inspection by a qualified person.

Filters and Purifiers

  • Replace filters on central HVAC systems and portable purifiers according to general manufacturer guidance, or more often in dusty or smoky conditions.
  • Recognize that carbon and similar gas-phase filters saturate over time; odor control usually declines before airflow does.
  • Keep intakes and outlets clear so devices can move their rated airflow.

Simple Observation and Basic Monitors

Even without advanced equipment, people can track a few helpful signals:

  • How quickly humidity and odors clear after showers or cooking.
  • Whether some rooms consistently feel heavy or stale compared with others.
  • Condensation on windows during cold weather, which can signal excess moisture relative to the ventilation level.

Some low-cost monitors show approximate CO₂, particle levels (PM2.5), or overall VOC estimates. These can offer general trends, but readings should be viewed as guidance rather than precise medical or regulatory information.

Table 2. Example ACH planning ideas for typical home scenarios – Example values for illustration.
Scenario (home use) Example ACH range What it suggests Notes (illustrative only)
Whole home, typical occupancy ~0.35–0.5 ACH Moderate fresh air for general comfort. Often cited as a planning level, not a hard rule.
Bedroom with 1–2 sleepers ~0.5–1 ACH effective Helps reduce overnight stuffiness. Can come from a mix of ventilation and recirculation.
Bathroom during and after showers 1–5 ACH equivalent Quickly removes moisture peaks. Achieved mainly with exhaust fans while occupied.
Kitchen while cooking Several ACH in zone Captures moisture, particles, and odors. Range hoods and local ventilation do most of the work.
Living room with many guests ~1–3 ACH effective Improves comfort during gatherings. Open windows and fans can temporarily boost exchange.
Wildfire smoke outside Lower outdoor ACH, higher filtered ACH Limits smoke entry while cleaning indoor air. More reliance on filtration during peak smoke events.

Example values for illustration.


Related guides: Ventilation vs Air Purifier: When You Need One, the Other, or BothACH to CADR Conversion: A Simple Formula With ExamplesHow to Choose the Right Air Purifier for Your Room Size

Key Takeaways: Connecting ACH, Infiltration, and Stuffy Rooms

Air exchange in homes is shaped by three main elements: natural leakage (infiltration), mechanical ventilation, and any filtration devices that recirculate indoor air. Together, they determine how quickly CO₂, moisture, particles, and odors are diluted or removed.

“Stuffy” rooms generally reflect low effective outdoor air per person, limited airflow paths, or moisture and odors that are not clearing. Addressing this usually involves:

  • Making better use of fans, windows, and doors to improve air movement and fresh air intake when feasible.
  • Using filtration to manage particles, especially in bedrooms, living rooms, or during outdoor pollution events.
  • Observing humidity, condensation, and odor behavior as simple indicators of whether existing air exchange is keeping up with daily life.

By understanding ACH and how infiltration and ventilation interact, homeowners can make calm, informed decisions about when to open windows, when to run fans, and how to pair those actions with air cleaning for a more comfortable indoor environment.

Frequently asked questions

How many ACH do I need to prevent a bedroom from feeling stuffy?

For a typical bedroom, a useful guideline is around 0.5–1 air changes per hour (ACH) effective, though exact needs vary with room size, number of occupants, and building tightness. That level can be achieved through a mix of mechanical ventilation, brief window airing, and recirculating filtration for particle control. If multiple people sleep in a small room, a higher effective exchange is often more comfortable.

Can an air purifier alone fix CO₂-related stuffiness?

No. Portable air purifiers remove particles and, if equipped, some gases and odors, but they do not bring in outdoor air and therefore do not lower CO₂ levels. To reduce CO₂ and the sensation of stuffiness you need ventilation such as opening windows, running exhaust fans, or a mechanical supply of outdoor air.

How can I tell if a room’s ventilation is insufficient without instruments?

Common cues include a room feeling fine at first then becoming stuffy after an hour, quick improvement when a window or fan is used, persistent condensation on mirrors or windows after showers, and lingering odors or musty smells. These observations suggest low effective outdoor air per person or poor airflow paths even when temperature seems normal.

What is the difference between infiltration and mechanical ventilation, and why does it matter?

Infiltration is unintentional air leakage through cracks and gaps driven by wind and temperature differences, while mechanical ventilation uses fans or duct systems to deliberately supply or exhaust air. The difference matters because older, leakier homes may get enough fresh air passively, whereas newer, tighter homes often require designed ventilation to maintain comfort and indoor air quality.

When should I reduce outdoor intake and rely more on filtration?

During periods of poor outdoor air quality such as heavy wildfire smoke, high pollen events, or nearby chemical releases, limit outdoor intake and use high-efficiency filtration or purifiers to avoid bringing contaminants indoors. Once outdoor air quality improves, restore some ventilation to control CO₂ and moisture while maintaining filtration as needed.