PM2.5 refers to fine particles with diameters of 2.5 micrometers or smaller. These particles come from sources such as outdoor pollution, wildfire smoke, cooking, and indoor activities that create dust or aerosols. Many people rely on electronic sensors to get a rough picture of their home’s particulate levels.
Two common options are:
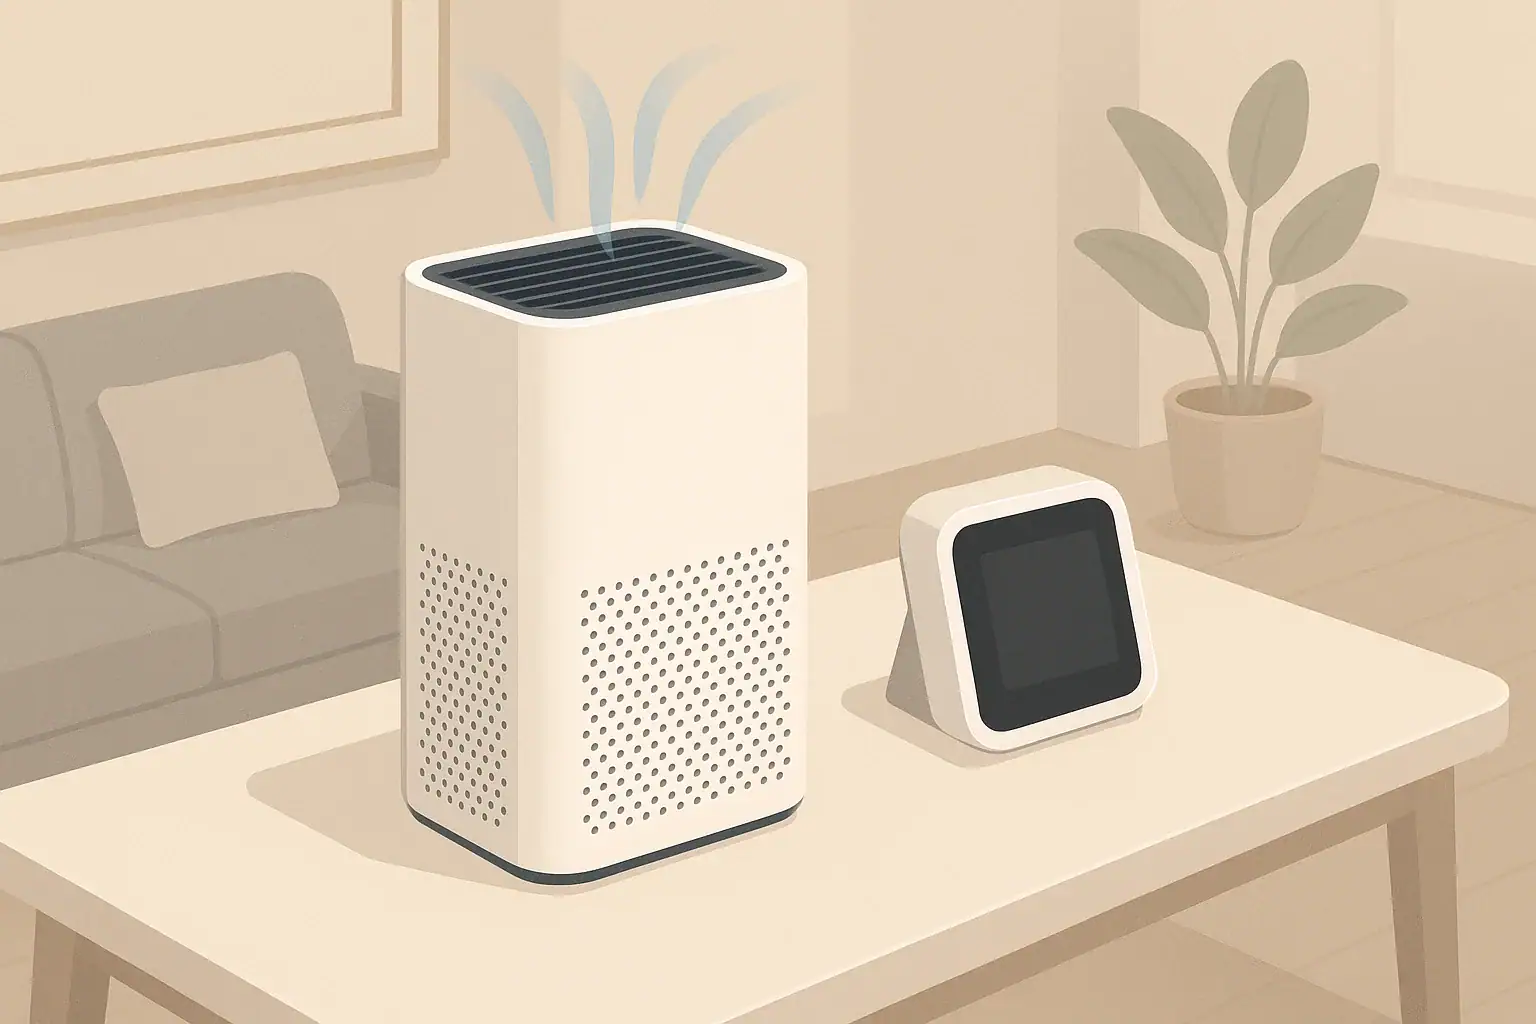
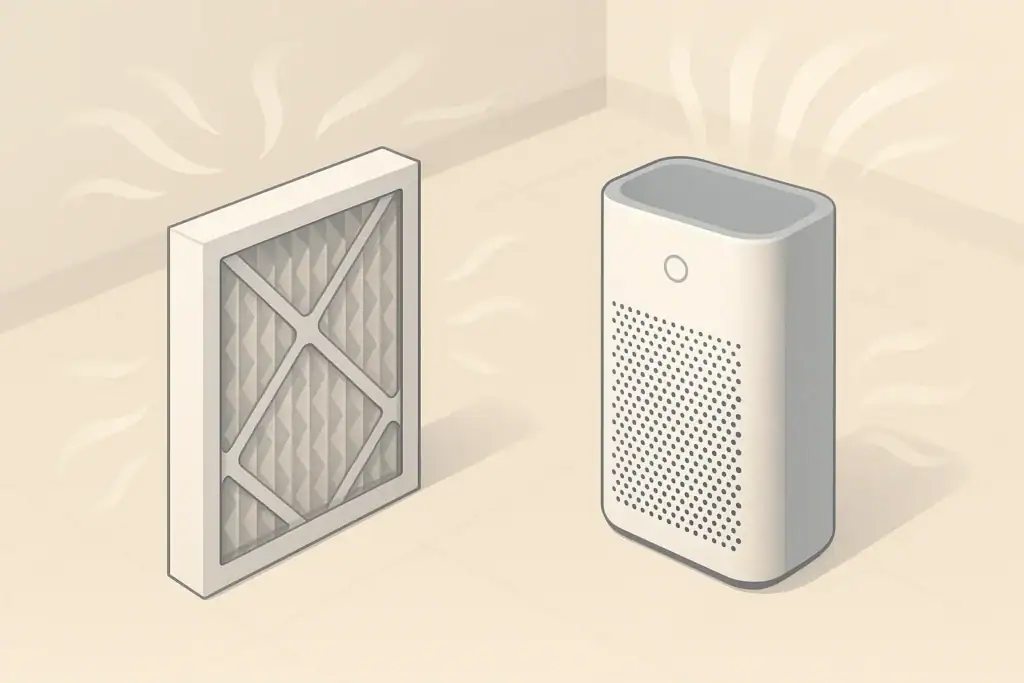
- Stand-alone PM2.5 monitors – independent devices designed primarily for measuring air quality.
- Built-in sensors in air purifiers – integrated into the purifier to adjust fan speed or show a basic air quality indicator.
While both may refer to “PM2.5,” they are not the same in design, accuracy, or how you should use the readings. Understanding the tradeoffs helps you set realistic expectations and make better decisions about placement, operation, and when to ventilate or run your purifier on higher speed.
PM2.5 Monitor vs Air Purifier Sensor: What Is the Difference?
PM2.5 refers to fine particles with diameters of 2.5 micrometers or smaller. These particles come from sources such as outdoor pollution, wildfire smoke, cooking, and indoor activities that create dust or aerosols. Many people rely on electronic sensors to get a rough picture of their home’s particulate levels.
Two common options are:
- Stand-alone PM2.5 monitors – independent devices designed primarily for measuring air quality.
- Built-in sensors in air purifiers – integrated into the purifier to adjust fan speed or show a basic air quality indicator.
While both may refer to “PM2.5,” they are not the same in design, accuracy, or how you should use the readings. Understanding the tradeoffs helps you set realistic expectations and make better decisions about placement, operation, and when to ventilate or run your purifier on higher speed.
How PM2.5 Sensors Work in Monitors and Air Purifiers
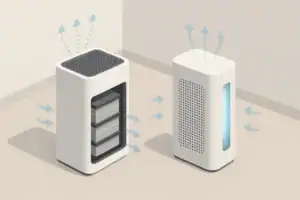
Most consumer PM2.5 sensors, whether in a dedicated monitor or built into an air purifier, are based on a similar principle: optical particle detection. They use a small light source and a photodetector inside a chamber where air flows through.
Optical PM2.5 Sensor Basics
In simple terms, the sensor:
- Draws air into a small chamber using a fan or natural convection.
- Shines light (often from an LED or laser diode) through the air sample.
- Measures how much light is scattered by particles passing through.
- Uses internal algorithms to estimate particle counts and sometimes mass concentration (for example, micrograms per cubic meter) in different size ranges such as PM1, PM2.5, or PM10.
These sensors are generally designed for trend and relative information rather than precise laboratory-grade readings. Still, they can be very useful for showing when particle levels are clearly higher or lower than your usual baseline.
What Makes Stand-Alone PM2.5 Monitors Different
Dedicated PM2.5 monitors focus on measuring air quality, not moving large volumes of air. Compared with many built-in purifier sensors, they often offer:
- More detailed readouts – numerical PM2.5 values, sometimes PM1 and PM10, and additional metrics like TVOCs or CO2 equivalents.
- Better placement flexibility – you can position them away from walls, drafts, and direct purifier outlets to capture a more representative room sample.
- Longer averaging and logging – some models smooth readings over time or store trends to highlight daily patterns.
- Less self-interference – because they are not built into high-speed airflow devices, they may be less affected by turbulence and immediate clean-air output from a purifier.
However, consumer monitors still rely on low-cost optical sensors. They are not substitutes for regulatory-grade instruments used by authorities or research labs.
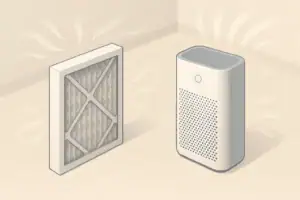
What Built-In Air Purifier Sensors Are Optimized For
Air purifier sensors are typically tuned for control and convenience rather than precision measurement. Their main jobs are:
- Detecting when particle levels increase so the purifier can ramp up fan speed (auto mode).
- Providing a simple air quality indicator, often a color or basic scale.
- Allowing the purifier to slow down when air is relatively cleaner to reduce noise and energy use.
These sensors are installed inside the purifier housing or near the air intake. Their readings are strongly influenced by where the purifier sits in the room and how air circulates. They are helpful for on-the-spot control but do not necessarily reflect overall room averages, especially in large or complex spaces.
Example values for illustration.
| Feature | Stand-alone PM2.5 monitor | Built-in air purifier sensor |
|---|---|---|
| Primary purpose | Measure and display air quality data | Control purifier speed and show simple status |
| Typical readout detail | Numeric PM2.5 and sometimes PM1/PM10 | Color ring or basic scale, occasional numeric PM2.5 |
| Placement flexibility | Can be moved to different rooms or spots | Fixed where purifier is located |
| Influence of purifier airflow | Lower if placed away from purifier outlet | Higher, since it samples air at or near the unit |
| Usefulness for whole-room overview | Often better if positioned thoughtfully | Good for local conditions near the purifier |
| Role in decisions | Helps plan ventilation, purifier use, and habits | Helps automate fan speed and respond quickly |
| Maintenance needs | Keep sensor inlet clean; avoid dust buildup | Occasional sensor area cleaning if accessible |
Accuracy Expectations: How Reliable Are the Readings?
Consumer PM2.5 sensors are useful tools, but it is important to see them as guides, not lab instruments. Accuracy varies widely between devices and even between units of the same model. Several factors affect reliability.
Sensor Calibration and Drift
Low-cost optical sensors are typically factory-calibrated using standard test aerosols. Over time, their response can drift as the light source ages or dust builds up inside the sensing chamber.
Common implications include:
- Offset errors – the sensor might read somewhat higher or lower than the true concentration but still track changes reasonably well.
- Nonlinear response – differences may become larger at very high or very low concentrations.
- Device-to-device variation – two monitors side by side may disagree by a noticeable margin, yet both can still reflect trends.
Most home users do not have access to formal calibration services. Instead, you can use these devices to see relative changes: for example, how much PM2.5 increases when you fry food or how quickly levels drop after turning a purifier to a higher setting.
Sampling Location and Airflow
Where the sensor is placed often matters more than small differences in factory calibration.
- Near a source (stove, candle, smoking area) readings can spike very quickly and may not represent the average across the room.
- Near supply vents or open windows the sensor may show more of the incoming outdoor air than the room as a whole.
- Inside or next to a purifier built-in sensors may see cleaner air than the far corners of the room, especially if the purifier is strong relative to the room size.
To understand overall room air, aim for a representative and stable position: away from direct vents, not on the floor, and not right next to obvious particle sources.
Particle Type and Humidity Effects
Optical sensors estimate particle mass based on how particles scatter light and on assumptions about their size and density. This can lead to differences when particle types change.
- Smoke particles may scatter light differently than dust from vacuuming or from outdoor soil.
- Humidity can cause hygroscopic particles to swell, changing measured scattering without an actual change in dry mass.
- Very high humidity may cause fog-like droplets that optical sensors interpret as high particle levels.
Because of this, a PM2.5 reading is best seen as an index related to particle load, especially when humidity or particle sources are changing.
When a Stand-Alone PM2.5 Monitor Is Most Helpful
Adding a stand-alone monitor can make sense when you want a clearer picture of indoor air behavior over time or across multiple rooms. It can also help you use your air purifier more strategically rather than running it blindly.
Understanding Daily and Seasonal Patterns
A monitor placed in a main living area can reveal patterns such as:
- Spikes during cooking or high-heat oven use.
- Increases when doors or windows are opened on polluted days.
- Seasonal changes during wildfire periods, cold snaps, or pollen-heavy seasons (for particles that behave like PM2.5).
Seeing trends helps you decide when to close windows, when to use a range hood more consistently, or when to run purifiers at higher settings.
Checking Room Coverage and Purifier Placement
If you already use an air purifier, a monitor can show how effective your setup is:
- Place the monitor across the room from the purifier to see whether PM2.5 levels drop there, not just near the unit.
- Try different purifier locations (for example, more central vs corner) and note how fast levels fall after a particle spike such as cooking.
- Compare readings with doors open vs closed between rooms to understand how well air circulates.
This can guide decisions about whether you need additional purifiers for other rooms or just better placement and door management.
Sharing One Monitor Between Spaces
In smaller homes or apartments, you can rotate a single PM2.5 monitor:
- Keep it in the living area most of the time for general tracking.
- Move it to a bedroom for a night or two to see overnight levels.
- Occasionally check kitchens or basements if you suspect dust or smoke buildup.
Short checks in different rooms can help you prioritize where to run purifiers or improve ventilation, without buying multiple monitors.
Using an Air Purifier’s Built-In Sensor Effectively
Even without a separate monitor, the sensor inside an air purifier can provide useful feedback—especially for auto mode and general awareness.
Auto Mode and Fan Speed Behavior
When you use auto mode, the purifier interprets its sensor input to adjust fan speed. Typical behavior includes:
- Low fan speed when the sensor detects relatively clean air.
- Higher fan speed when the sensor sees increased particles (for example, from cooking or outdoor smoke entering).
- Gradual reduction in speed as particles are removed near the purifier’s intake.
Auto modes are useful for set-and-forget convenience, but remember that the sensor reacts to air at or near the unit. If your purifier is in a corner and a far room has higher pollution, auto mode might not fully respond to that distant condition.
Reading Color Indicators and Basic Scales
Many purifiers show a color ring or simple air quality scale. While the exact thresholds vary by manufacturer, you can still use the changes as a guide:
- Use color changes to learn which activities (broiling, sanding, candles) generate noticeable particles.
- Note how long it takes for the indicator to transition from “poor” to “better” after the source stops.
- If the indicator rarely changes, try moving the purifier closer to likely particle sources to see more responsive behavior.
These indicators can be especially useful for people who prefer not to think about numbers and just want to know whether the purifier is working harder than usual.
Limitations for Whole-Home Air-Quality Insights
An integrated sensor has a narrow field of view. It may not show:
- Conditions in closed rooms away from the purifier.
- Small localized sources such as printer dust, craft work, or a candle in another room.
- Differences in multi-level homes where air mixing is limited.
For these situations, a separate PM2.5 monitor—or an additional purifier in key rooms—can provide more complete coverage.
Practical Placement Tips for Better PM2.5 Readings
Whether you rely on a stand-alone monitor or a purifier’s internal sensor, placement is one of the easiest ways to improve usefulness.
Where to Place a Stand-Alone PM2.5 Monitor
For more representative readings:
- Place the monitor about breathing height when seated or standing, such as on a shelf or table.
- Avoid placing it directly in front of vents, windows, or fans that may blow air straight into the inlet.
- Keep it several feet away from air purifier outlets so it does not only sample freshly filtered air.
- Do not place it on the floor in a corner, where airflow may be limited and dust accumulation can skew readings.
If you are investigating a specific issue (such as cooking smoke traveling down a hallway), it is reasonable to place the monitor temporarily near that path, as long as you understand those readings are more localized.
Optimizing Air Purifier Position for Sensor Performance
Because the purifier’s built-in sensor samples air where the unit sits, good purifier placement also helps sensor usefulness.
- Place purifiers in relatively open areas, not hidden behind furniture or curtains.
- Avoid pushing the back of the purifier right against a wall if the intake is on that side; allow some space for airflow.
- If your main particle source is in a known area (for example, near the kitchen), consider placing the purifier within that general zone while keeping it clear of splashes or heat.
These steps help the sensor see air that is more representative of the room instead of a blocked or stagnant pocket.
Interpreting Readings for Everyday Decisions
Numbers or color codes become more useful when you know how to respond to them in simple, practical ways. The goal is not perfection but informed choices about ventilation, filtration, and habits.
Using PM2.5 Readings with Ventilation
Ventilation and filtration can complement each other, especially when outdoor air quality is acceptable.
- When both indoor and outdoor air are relatively low in particles, opening windows can refresh indoor air and dilute indoor sources.
- If outdoor air is noticeably worse (such as during a wildfire event or heavy traffic pollution), readings may stay lower indoors with windows closed and purifiers running.
- A PM2.5 monitor near a frequently opened door can show whether outdoor spikes are entering and lingering.
Tracking these patterns over time helps you decide when to rely more on natural ventilation and when to lean on filtration.
Coordinating Multiple Purifiers and Rooms
In larger homes, you might operate more than one purifier. A stand-alone monitor can help you:
- Identify which rooms benefit most from a dedicated purifier.
- Check whether a single purifier in a hallway can meaningfully reduce PM2.5 in adjacent rooms.
- Decide whether doors should be left open or closed while purifiers run, based on how readings rise or fall.
Even if you mostly rely on built-in sensors and auto modes, occasional checks with a PM2.5 monitor can validate that your coverage strategy is working as intended.
Adjusting Habits in Response to Spikes
Monitoring can highlight simple behavior changes that reduce particle loads:
- Using a range hood consistently during cooking that produces smoke or grease.
- Avoiding activities such as heavy indoor sanding or spraying near living spaces without extra ventilation and filtration.
- Vacuuming with a well-sealed machine and filter, and running a purifier nearby during and after cleaning sessions.
These changes, guided by sensor feedback, can lower the frequency and duration of high particle episodes indoors.
Example values for illustration.
| Metric | What it generally indicates | Common pitfalls | Simple action idea |
|---|---|---|---|
| PM2.5 | Fine particle load from smoke, cooking, dust | Values vary between devices; humidity can affect readings | Use purifiers or ventilation when sustained levels are elevated |
| PM10 | Larger particles like coarse dust and some pollen | Short spikes may come from cleaning or movement only | Vacuum and dust regularly; check filter condition |
| TVOC (generic) | Overall volatile organic compounds estimate | Readings can change with perfumes, cleaning products, or cooking fumes | Increase ventilation and reduce strong chemical product use |
| CO2 (or estimated) | Indicator of occupancy and ventilation rate | Estimated values may not match dedicated CO2 sensors | Open windows or increase fresh air when persistently elevated |
| Humidity | Moisture level in the air | Placement near kitchens or bathrooms can skew readings | Use humidifiers or dehumidifiers to stay in a moderate range |
| Temperature | Indoor comfort and HVAC operation | Direct sun or drafts can create local hot or cold spots | Adjust thermostat and check for drafts or heat sources |
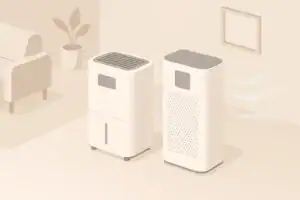
Bringing It All Together at Home
Both stand-alone PM2.5 monitors and air purifier sensors can play useful roles in managing indoor air. The built-in sensor in a purifier is well-suited for everyday automation and quick feedback. A separate monitor adds flexibility, helps you understand patterns across rooms and seasons, and lets you verify whether your purifiers, ventilation strategies, and habits are working as intended.
Rather than focusing on exact numbers, use these tools to recognize trends, compare before-and-after scenarios, and guide practical steps such as improving ventilation, adjusting purifier placement, and managing activities that generate particles. With that mindset, even modest consumer sensors can become effective aids for maintaining more comfortable and consistently cleaner indoor air.
Frequently asked questions
How much more accurate is a stand-alone PM2.5 monitor compared with an air purifier’s built-in sensor?
Stand-alone monitors typically provide more detailed numerical readouts and are placed for representative sampling, so they often give a better room-average view. However, both device types commonly use similar low-cost optical sensors, so neither is equivalent to laboratory instruments; the main advantage of a monitor is placement flexibility and logging, not a fundamentally different sensing principle.
Can I rely on my purifier’s sensor to decide whether to open windows during outdoor pollution events?
Not by itself: a purifier’s sensor reads air near the unit and may not reflect conditions near doors or other parts of the home. For window-opening decisions during pollution events, cross-check with a separate monitor placed near the doorway or consult up-to-date outdoor air quality information.
What is the best placement for a PM2.5 monitor to reflect typical indoor exposure?
Place the monitor at breathing height on a table or shelf in the main living area, away from direct vents, windows, and purifier outlets. Avoid floors, corners, and very near particle sources unless you are intentionally measuring localized spikes.
How often should I clean or recalibrate PM2.5 sensors to keep readings reliable?
Perform basic maintenance like gently cleaning the sensor inlet area every few months or according to the device manual to reduce dust buildup; this helps limit drift. Formal recalibration is rarely available for consumer devices, so periodic cross-checks against another monitor or known events (like outdoor spikes) are practical ways to confirm continued usefulness.
Will humidity or different particle types affect readings differently between monitors and purifier sensors?
Yes. Both types use optical detection and can overestimate particle load when hygroscopic particles swell in high humidity or when fog droplets are present. Differences in measured values between devices are often driven more by sampling location and vendor algorithms than by the particle type alone.
Recommended next:
- HEPA vs Activated Carbon: Best Setup for Allergies, Odors, and Smoke
- Air Purifier vs Dehumidifier: Which One Solves Musty Air?
- Humidifier vs Dehumidifier: When to Add Moisture vs Remove It
- Air Purifier vs Ozone Generator: Safety, Effectiveness, and Myths
- HEPA vs Carbon Filters: When Each One Matters Most
- Air Purifier vs Ventilation: Which Fixes Stuffy Bedrooms Better?
- More in Comparisons →
- Clear sizing logic (room size → CADR/ACH)
- HEPA vs carbon explained for real use-cases
- Humidity + ventilation basics to reduce mold risk


About this site
Home Air Quality Lab publishes practical, independent guides about indoor air quality—clear sizing, safer use, and real-world expectations.
Affiliate disclosure
Some links on this site may be affiliate links. If you buy through these links, we may earn a small commission at no extra cost to you. This helps support our content. Learn more.