
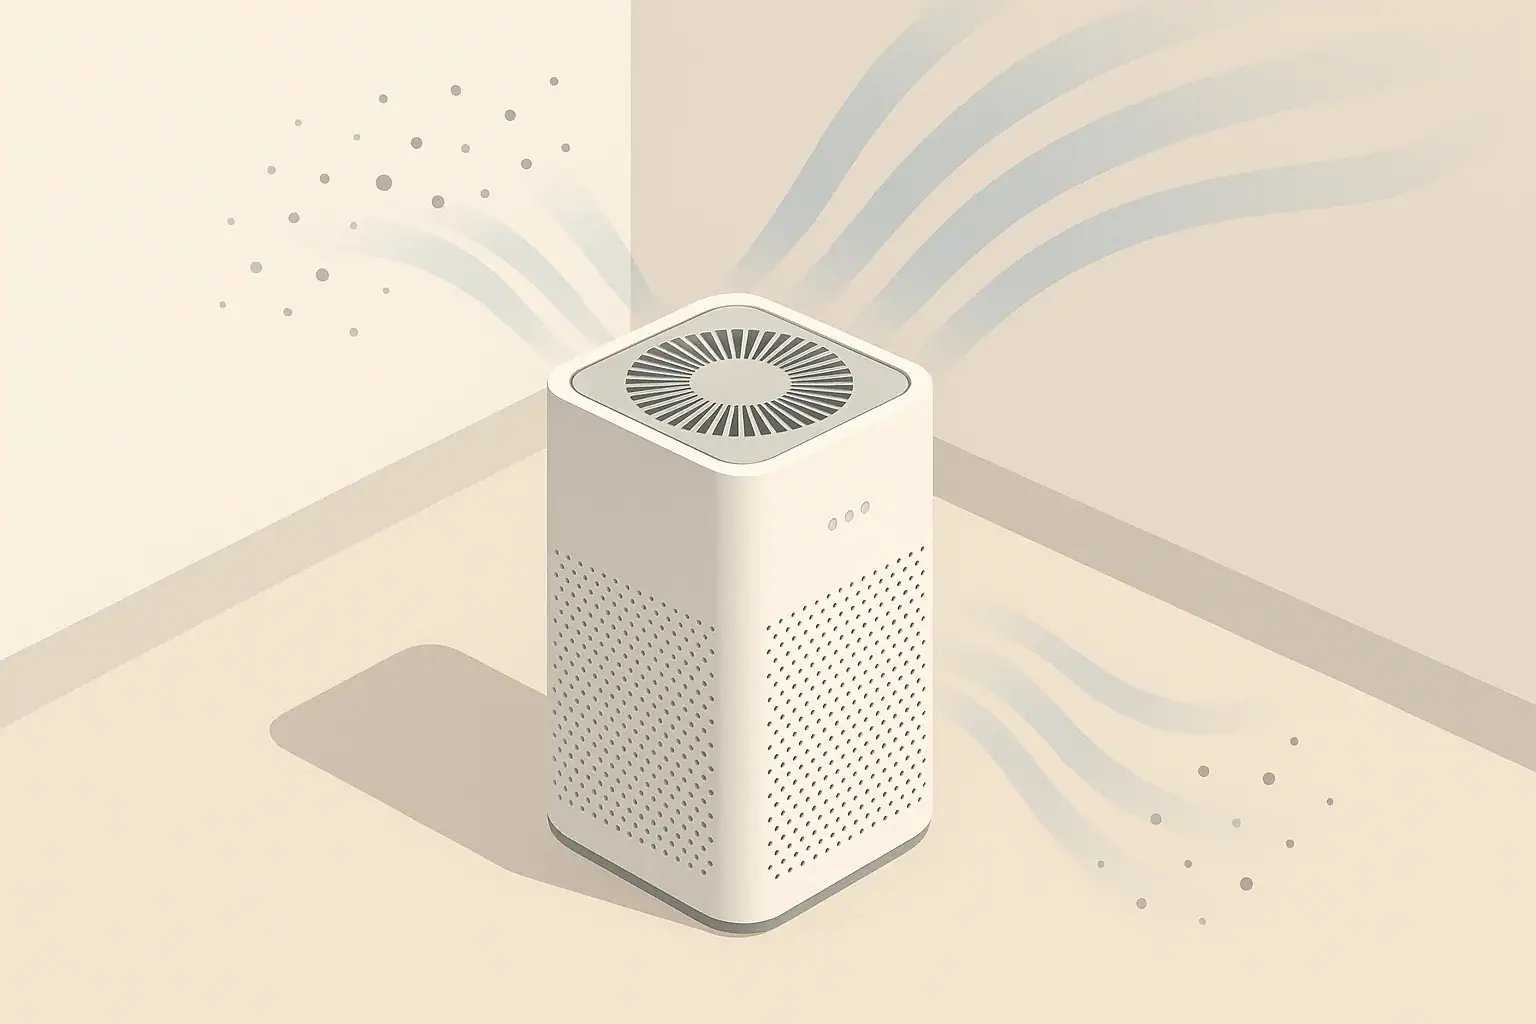
You can run an air purifier dust test by logging PM2.5 with an air quality monitor before and after one controlled change, then comparing similar time windows.
The goal is not to prove a perfect number; it is to see whether changes such as purifier placement, fan speed, filter replacement, cleaning, or ventilation affect measured particles in your room. PM2.5 readings can be noisy, so use repeated measurements and note what happened in the room.
- Log a baseline for at least 24 hours when possible; 48 hours is better if daily routines vary.
- Change one thing at a time, such as fan speed, purifier location, filter age, window opening, or cleaning method.
- Compare the same time windows, such as evening to evening, instead of comparing unrelated moments.
- For many homes, a practical comfort-oriented aim is lower and steadier PM2.5, often single digits to low teens in micrograms per cubic meter when outdoor air is also clean.
- A repeated 20% to 50% drop under similar conditions can be a useful sign that the change is helping, but results depend on room size, sources, airflow, and outdoor air.
- Keep notes on cooking, candles, vacuuming, open windows, humidity, and outdoor smoke because these can change readings quickly.
What an air purifier dust test measures
An air purifier dust test is a simple before-and-after comparison using a particle monitor. In most home testing, the main number to track is PM2.5, which means airborne particles with an aerodynamic diameter of about 2.5 micrometers or smaller.
PM2.5 is not the same as visible dust on furniture. Larger dust can settle on surfaces quickly, while fine particles can stay suspended longer and move with room air. A purifier with a particle filter can reduce suspended particles when it is sized, placed, and operated well for the room.
Home monitors estimate PM2.5 using optical sensors. They are useful for trends and comparisons, but they are not laboratory instruments. Treat the number as a practical signal, especially when the same monitor is used in the same place before and after a change.
Key PM2.5 concepts before you test
Use the same monitor in the same location
Consistency matters more than perfection. Place the monitor in the breathing zone of the room, away from direct purifier airflow, open windows, steam, and cooking bursts. A side table, desk, or shelf away from a wall can work well.
Understand what changes PM2.5 indoors
PM2.5 can rise from cooking, smoke, candles, incense, some cleaning activities, outdoor air, dust disturbance, and fine particles tracked in from outside. It can drop when particles settle, when ventilation removes them, or when a purifier captures them.
Plan around CADR and air changes
Clean air delivery rate, often shortened to CADR, is a general sizing concept for particle filtration. A higher CADR can clean a given room faster, assuming the air can circulate to the purifier. Air changes per hour, or ACH, estimates how many times the room air volume is cleaned in one hour.
A simple planning formula is: room volume in cubic feet multiplied by desired ACH, then divided by 60, equals an approximate clean air delivery target in cubic feet per minute. For example, a 150-square-foot room with an 8-foot ceiling has about 1,200 cubic feet of air. At 5 ACH, the planning target would be about 100 cubic feet per minute of clean air delivery. This is an illustration, not a guarantee, because furniture, door position, filter loading, and fan setting affect performance.
Example values for illustration.
| Task | Why it matters | Practical note |
|---|---|---|
| Record a baseline | Shows the normal pattern before changes | Use 24 to 48 hours when possible |
| Keep monitor placement fixed | Reduces sensor location bias | Avoid direct purifier exhaust |
| Change one variable | Makes results easier to interpret | Test fan speed, placement, or filter age separately |
| Match time windows | Daily routines affect particles | Compare similar hours on similar days |
| Log particle sources | Spikes may come from activities | Note cooking, candles, cleaning, and outdoor smoke |
| Use averages and peaks | Both steadiness and spikes matter | Review hourly averages if the monitor provides them |
| Repeat after changes | One test can be an outlier | Look for a repeated direction of change |
Common mistakes that distort before-and-after results
The most common mistake is changing too many things at once. If you replace a filter, move the purifier, open a window, and vacuum on the same day, you may see a cleaner reading but not know which step mattered.
Another mistake is testing only for a few minutes. PM2.5 changes quickly near a source, but room-level results take time to stabilize. A short test can be useful for seeing a cooking spike or a purifier response, but it is not enough to understand a whole-room pattern.
Direct airflow can also mislead the monitor. If the purifier outlet blows toward the sensor, the reading can look lower than the rest of the room. If the sensor is near a carpet being disturbed, it can look higher than the general room air.
Humidity can affect some optical particle sensors. Very humid air, steam, or water droplets can be interpreted as particles by some monitors. For routine testing, try to keep indoor relative humidity in a typical comfort range, often around 30% to 50%, and avoid placing the monitor near showers, humidifiers, or boiling water.
How to run an air purifier dust test step by step
Step 1: Pick one room and one question
Choose a specific question, such as whether higher fan speed lowers evening PM2.5 in the bedroom, or whether moving the purifier away from a corner improves particle reduction in a living room. A clear question keeps the test focused.
Step 2: Create a baseline
Run the room as usual and log readings. If your monitor exports data, save hourly averages. If it only shows live readings, write down several readings during the day and note activities that may affect particles.
Step 3: Make one change
Examples include moving the purifier several feet away from a wall, increasing fan speed during cooking, closing a bedroom door at night, replacing an overdue particle filter, or reducing an indoor particle source. Avoid making several changes at the same time.
Step 4: Compare similar periods
Compare before and after readings for the same type of time window. For example, compare two nights with the door position and fan setting noted, or compare two dinner periods with similar cooking patterns.
Step 5: Look for direction and consistency
A single spike is less useful than a repeated pattern. Review whether the average PM2.5 is lower, whether peaks are shorter, and whether the room returns to a lower level faster after activity. If the change is small or inconsistent, repeat the test or look for uncontrolled variables.
Real-world PM2.5 testing examples
Bedroom night test
A bedroom test might compare two nights with the purifier on a low setting versus two nights on a medium setting. Keep the door position, monitor location, and bedding routine the same. If the medium setting repeatedly produces lower overnight averages without unacceptable noise, that setting may be more practical for that room.
Open-plan living area after cooking
Cooking can create a short PM2.5 spike, especially when using high heat. A practical test might compare using kitchen exhaust plus a purifier in the nearby living area against the same cooking routine without the purifier. Focus on how high the spike gets and how long it takes to return near the earlier background level.
Filter replacement check
If a purifier has been running for months, compare readings before and after replacing the particle filter, while leaving placement and fan speed unchanged. A clogged filter can reduce airflow, but results vary by filter load, room conditions, and use pattern.
Placement check in a cluttered room
A purifier blocked by furniture may move less room air. Test the same unit in a more open location while keeping the monitor away from the direct outlet. Improvement may appear as faster recovery after a particle event rather than a dramatic change in the daily average.
Safety and standards to keep in mind
For a dust and PM2.5 test, the safest focus is mechanical particle filtration and sensible airflow. A well-sealed particle filter and adequate room circulation are usually the core factors to evaluate.
Some air cleaning devices include ionizers, plasma features, or other electronic add-ons. These features are often marketed for particles or odors, but they should be considered carefully because some technologies can produce ozone or other byproducts under certain conditions. If a device has an optional ionizing function, check whether it can be turned off and review independent safety information.
UV-C is sometimes used inside equipment to affect microbes on internal surfaces, but it does not replace particle filtration for a PM2.5 dust test. Home users should not modify devices, bypass interlocks, or expose eyes or skin to UV-C sources.
Ozone should not be intentionally generated for occupied indoor air cleaning. For home PM2.5 tracking, use ozone-free strategies such as source control, ventilation when outdoor air is acceptable, and properly maintained filtration.
Maintenance and data upkeep for better testing
Good data depends on both the purifier and the monitor. Keep the purifier intake and outlet clear, clean prefilters according to the manufacturer instructions, and replace filters within the recommended range or sooner if airflow drops noticeably in a dusty space.
Monitors also need basic care. Keep the sensor opening free of dust buildup, avoid spraying cleaners near it, and let it sit in one place long enough to stabilize. If your monitor offers calibration or reset instructions, follow the manufacturer guidance rather than guessing.
Cost planning is part of realistic testing. A purifier that only performs well on a setting too loud for daily use may not deliver the same results in normal life. Track the fan setting you actually use, because low-speed operation can provide much less clean airflow than higher-speed operation.
Example values for illustration.
| Metric | What it indicates | Common pitfall | Action idea |
|---|---|---|---|
| PM2.5 | Fine particle trend in the room | Short spikes can dominate attention | Compare averages and recovery time |
| PM10 | Larger airborne particle trend | Can vary with movement and dust disturbance | Note vacuuming, sweeping, and foot traffic |
| CO2 | Ventilation and occupancy pattern | Not a particle measurement | Use it to understand air exchange context |
| TVOC | General sensor response to some gases | Consumer sensors are broad and non-specific | Use source notes and ventilation context |
| Relative humidity | Moisture level affecting comfort and sensors | Steam may distort particle readings | Place monitor away from humidifiers and showers |
| Temperature | Room condition during the test | May change with windows or HVAC cycles | Log major changes when comparing days |
Related guides: PM2.5 Indoors: Common Sources and the Fastest Fixes • Where to Place an Air Quality Monitor: Height, Distance, and Rooms • Air Purifier Placement: Where to Put It for Best Results
Frequently asked questions
How long should I run an air purifier dust test before comparing results?
A baseline of at least 24 hours is usually better than a short test, and 48 hours is even more useful if your daily routine changes. Shorter tests can show immediate effects, but they are easier to distort with cooking, cleaning, or open windows.
What is the best PM2.5 number to watch during a dust test?
PM2.5 is generally the most useful metric because it reflects fine airborne particles that a purifier is meant to reduce. For comparison, focus on the average level, the size of spikes, and how quickly the room returns to a lower level after an event.
Why does my monitor show a lower reading near the purifier?
A monitor placed in the purifier’s direct airflow can read artificially low because it is sampling air that has just passed through the filter. Place the sensor in a more neutral part of the room, away from the outlet, so it reflects room air more fairly.
Can humidity affect an air purifier dust test?
Yes, some optical sensors can react to steam, mist, or very humid air as if they were particles. For cleaner comparisons, keep the monitor away from showers, humidifiers, and boiling water, and try to test in a normal indoor comfort range.
What change is most worth testing first?
The best first test is usually the change most likely to affect particles in your room, such as fan speed, purifier placement, filter replacement, or controlling a cooking source. Change only one variable at a time so you can tell what actually improved the reading.
Summary: what to watch in your dust test
An air purifier dust test works best when it is simple, repeated, and controlled. Use one monitor, one room, one main question, and one change at a time.
Track PM2.5 before and after the change, but also write down the context: cooking, cleaning, windows, outdoor air, fan setting, filter age, and room use. Look for lower averages, shorter peaks, and faster recovery after particle events rather than relying on one perfect reading.
If results are unclear, extend the baseline, repeat the test, or improve the setup by moving the monitor away from direct airflow and keeping the purifier unobstructed. The practical goal is not a laboratory measurement; it is a calmer, more consistent way to understand what actually changes indoor particle levels in your home.
Recommended next:
- PM2.5 Explained: What the Numbers Mean and What’s a Safe Level Indoors
- How to Reduce Dust in Your Home (Without Constant Cleaning)
- Wildfire Smoke Indoors: Step-by-Step Plan to Lower PM2.5 Fast
- PM2.5 Indoors: Common Sources and the Fastest Fixes
- Cooking PM2.5 Spikes: What to Do Before, During, and After Cooking
- Candles and Incense: How Much Particulate Pollution Do They Create?
- More in Dust, PM2.5 & Particles →
- Clear sizing logic (room size → CADR/ACH)
- HEPA vs carbon explained for real use-cases
- Humidity + ventilation basics to reduce mold risk